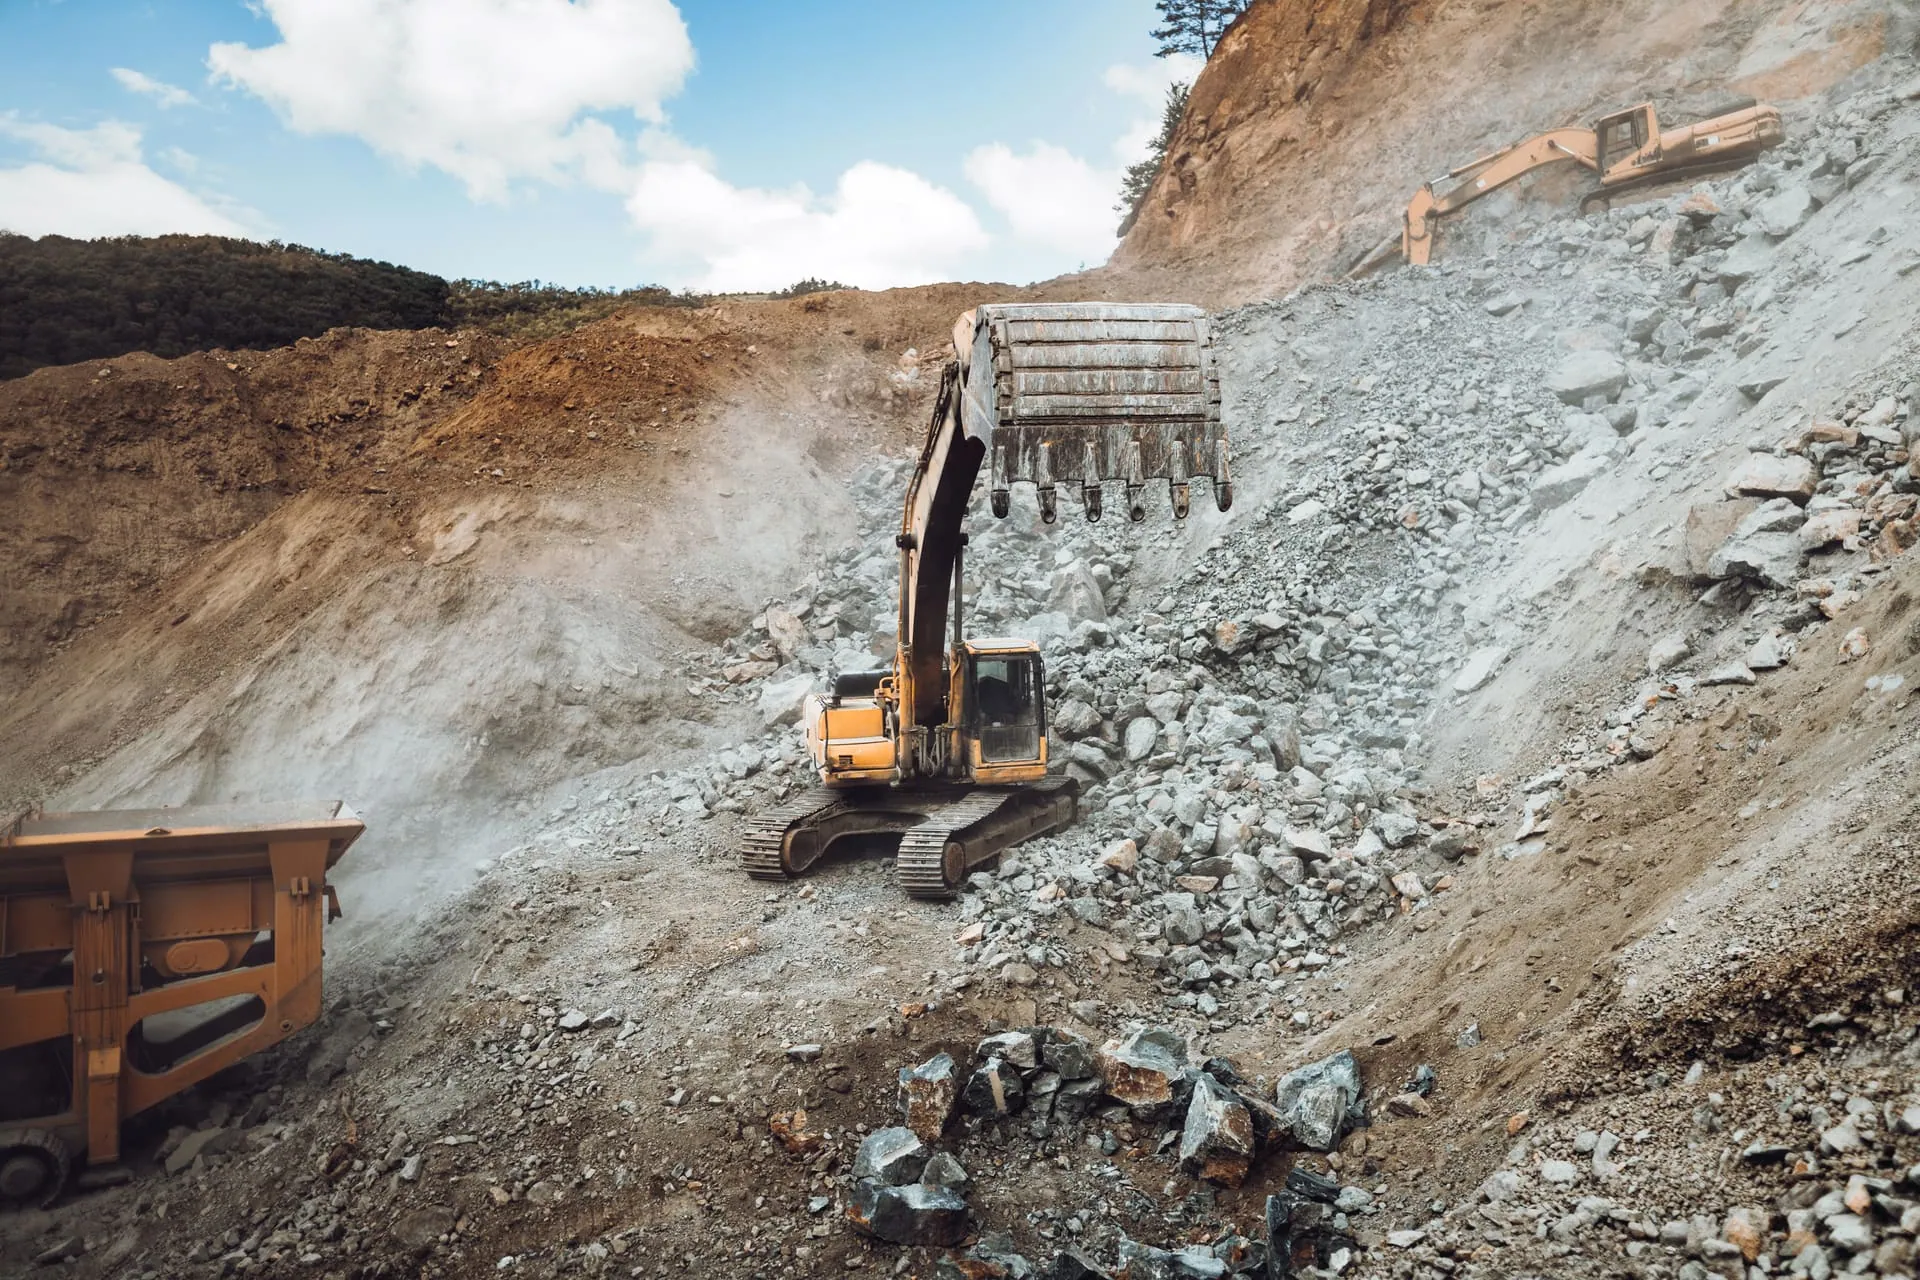
Fleet Management Software for Mining, Construction, Plant Hire and Civils in Ghana
Your fleet should not leak cedis in the dark.
Most fleet management software just shows dots on a map. Darikoda is an operational intelligence platform for heavy fleet operators in Ghana, built by Darikoda Systems Ltd, that shows where the money is actually going.
At a glance
In heavy industry, fleet management is not just tracking. It is the ability to connect the machine, the operator, the fuel burned and the hours worked to the actual output on the site. When those records do not match at month-end, the fleet is leaking. Darikoda is the operating record that keeps them matched. Captured at source.
Representative product workflow · Illustrative data
See how the operating record captures this workflow
Fleet Value-for-Money
Grader
OEM A
USD 64.20
lifetime cost / hr
OEM B
USD 88.50
lifetime cost / hr
The definition
What is fleet management software?
Fleet management software is the system that tells an operator what its equipment is doing, where it is, and what that activity costs. For a van fleet that is largely a location and routing question. For a heavy fleet it is not.
A mining, construction, plant hire or civils operation runs mixed assets across sites, shifts, operators and contracts. An excavator is not a vehicle to be routed. It is a cost centre that has to earn its keep against a work front, a contract rate or a tonnage target. Fleet management software for heavy industry therefore has to answer a wider set of questions.
- Where the equipment is.
- Whether it is available for work.
- How it is being used.
- Who is operating it.
- How many hours it works.
- Where the downtime occurs and what caused it.
- How fuel is being consumed against what was issued.
- What output is being produced for those hours.
- What approvals are pending against the asset.
- What evidence exists when the activity is disputed.
Traditional fleet software concentrates on the first three. Location, movement and asset status are the easiest signals to collect and the ones a tracker was built to deliver. Darikoda adds the operational record around the machine, which is where the remaining questions get answered.
The problem
Where the margin disappears
Operations lose control when the record is stitched together from memory, paper logs and WhatsApp groups. The most common leaks:
Fuel variance. The number at the pump never matches the number at the machine. Fuel management closes that gap.
Unexplained downtime. The machine sits waiting for parts, instructions or operators, and the report records the hours without the cause. Downtime tracking tells you which.
Under-used equipment. Assets sit below the utilisation the business is paying for, and the fleet average hides which ones. That drives the wrong allocation decisions and the wrong hire and purchase decisions after them.
Missing site records. Site reports do not match the reality at the chainage, so the office works from a version of the shift that nobody can source.
Weak operator accountability. Hours and fuel land against a machine and not against the person who was on it, which makes performance patterns impossible to see fairly.
Delayed approvals. A repair is identified on day one and authorised on day six. The asset is out of service for both, and only one of those is a mechanical problem.
Disconnected workshop records. The defect, the work order, the parts and the spend sit in separate places, so nobody holds the repair history of the asset in one thread. Maintenance visibility joins them up.
Month-end reconstruction. Three weeks after the shift, someone rebuilds it from memory and paper. That is where reporting time goes and where project-level visibility dies.
Commercial disputes. When the deduction or the cert review arrives, nobody holds the timestamped evidence to defend the work.
The margin is made and lost on site, by the shift.
Not in the office. In the hours, litres and loads that either get captured at source or get reconstructed from memory weeks later.
The distinction
Fleet management versus operational intelligence
Both approaches watch the same machine. They are built to hold different things. A tracking-first system is designed around the asset and its position. An operating record is designed around the event and its commercial consequence.
| What is held | Tracking-first approach | Darikoda operating record |
|---|---|---|
| Machine location | Continuous and accurate. This is what a tracker is built for. | Taken as an input. Location becomes commercially useful once it is tied to a site, a work front and a job. |
| Movement and operating hours | Engine-on time and hour-meter readings straight from the machine. | The same hours, attributed to an operator, a shift and the contract they were worked against. |
| Idle time | Idling is visible as a duration on the asset. | Idle time carries a reason. Waiting to load is not the same problem as waiting for a decision. |
| Downtime cause | Fault codes and machine health where the telematics feed supports it. | The cause the workshop, procurement or finance actually owns, with the recovery step and the person holding it. |
| Fuel | Fuel-burn telemetry from the engine where the feed provides it. | Fuel issued at the bowser set against fuel burned at the machine, so the variance is visible by asset. |
| Operator attribution | Available where the fleet runs driver identification hardware. | Every event attributed by PIN to the person at the point of work, on every asset class. |
| Approvals | Sits outside the tracking system. | The approval is part of the record, so a delayed decision shows up as an operational cost. |
| Commercial evidence | Movement history supports some disputes. | Timestamped, attributed evidence built for the deduction, the cert review and the audit. |
This is a difference of design intent, not a claim that trackers cannot be extended. Many can be, through integrations, and Darikoda is built to take telematics as an input rather than to replace it. The point is what each system holds by default. For the full comparison against ERP, GPS trackers, OEM telematics and spreadsheets, see how Darikoda compares, or read the category in full on operational intelligence.
How it works
How Darikoda fleet management works
Six steps, the same on every site. It starts with the Operational Audit, because the fix has to be aimed at the leak you actually have.
- 01
Operational Audit
Thirty minutes on your operation to find where records, fuel, downtime, utilisation and approvals are leaking. You keep the one-page map regardless of next steps.
- 02
Configure
Map the assets, sites, work fronts, roles and operational records the business actually runs on.
- 03
Capture
Operators and supervisors log activity at the machine. Offline-first, so a dropped signal never becomes a gap in the record.
- 04
Structure
Every entry is timestamped and tied to a machine, an operator, a job or site, and an event.
- 05
Review
Management reads utilisation, fuel variance, downtime cause and approval delay against the work that was planned.
- 06
Improve
The record drives the decisions that follow: allocation, maintenance, fuel accountability and how the month gets reported.
What is measured
The metrics that protect your margin
- Scheduled hours against available hours
- Actual running hours against idle time
- Productive hours against the work front they were booked to
- Idle hours and the reason behind each one
- Downtime duration by asset
- Downtime by exact cause, waiting for parts against breakdown
- Fuel issued at the bowser
- Fuel consumed at the machine
- Fuel variance between the two
- Equipment utilisation by specific chainage or site
- Operator assignment on every logged event
- Site and work area against each machine
- Approval bottlenecks delaying certs
- Maintenance events tied to the asset history
- Repair turnaround from defect raised to return to service
- Operational output against the hours that produced it

The fleet you own is not the fleet you can use.
Availability, utilisation and downtime are three different questions. A single fleet percentage answers none of them well enough to act on.
By industry
Built for heavy-fleet realities
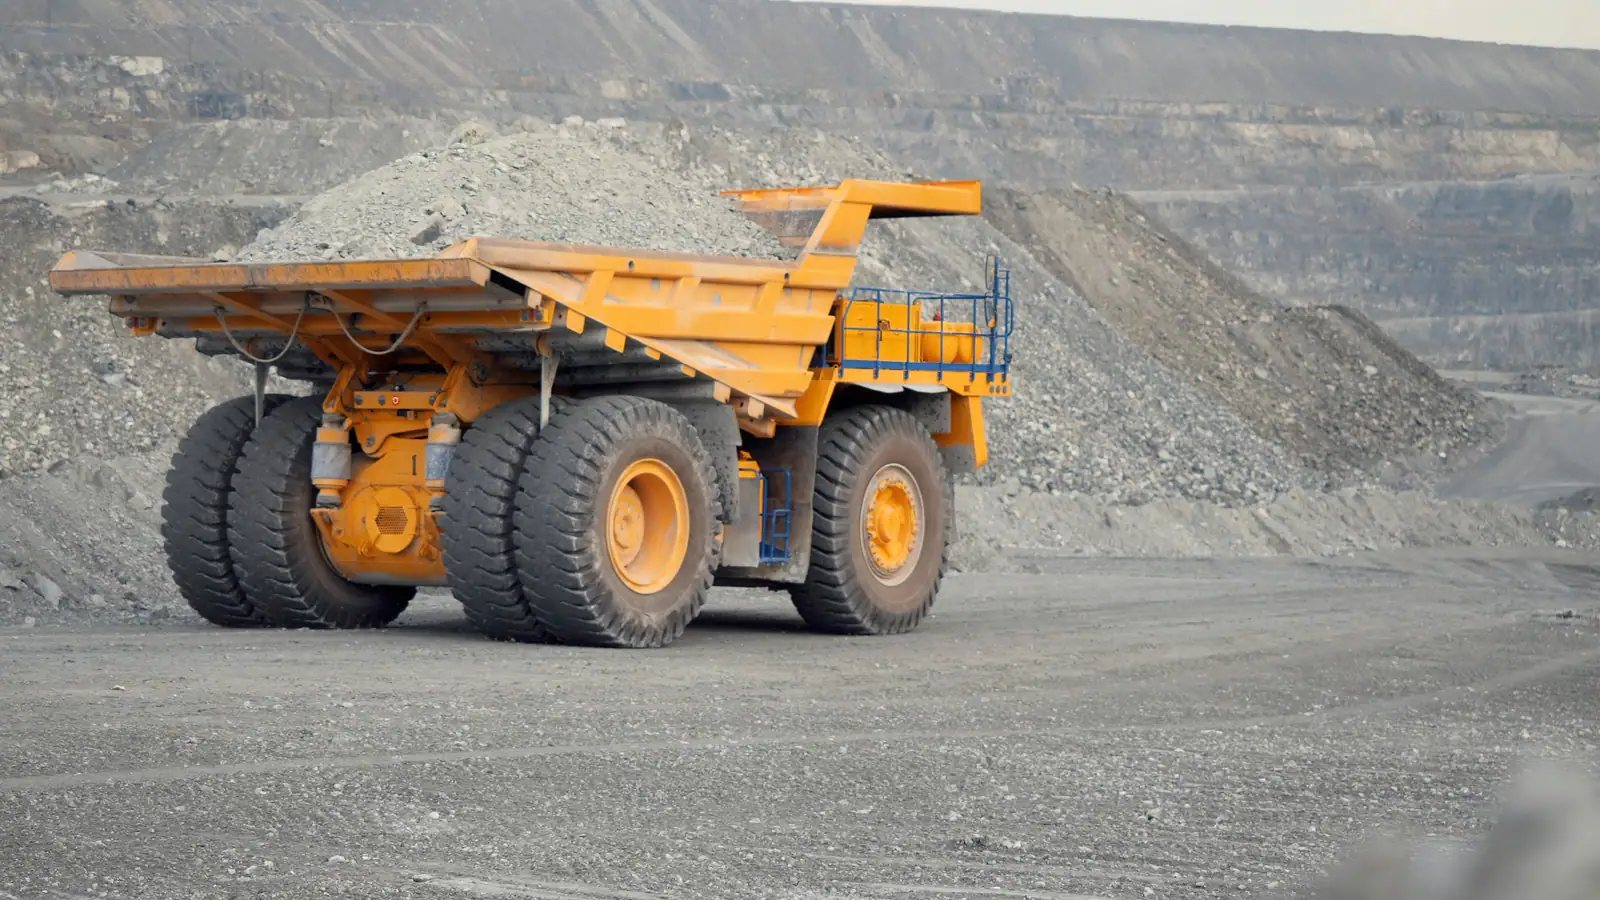
Mining
Haul cycles, equipment utilisation and fuel integrity on one record, with production and operator attribution attached to the hours that earned them. That is what puts a defendable cost per tonne in front of management and what holds contractor performance to evidence. Views for mining contractors and full mine operators.
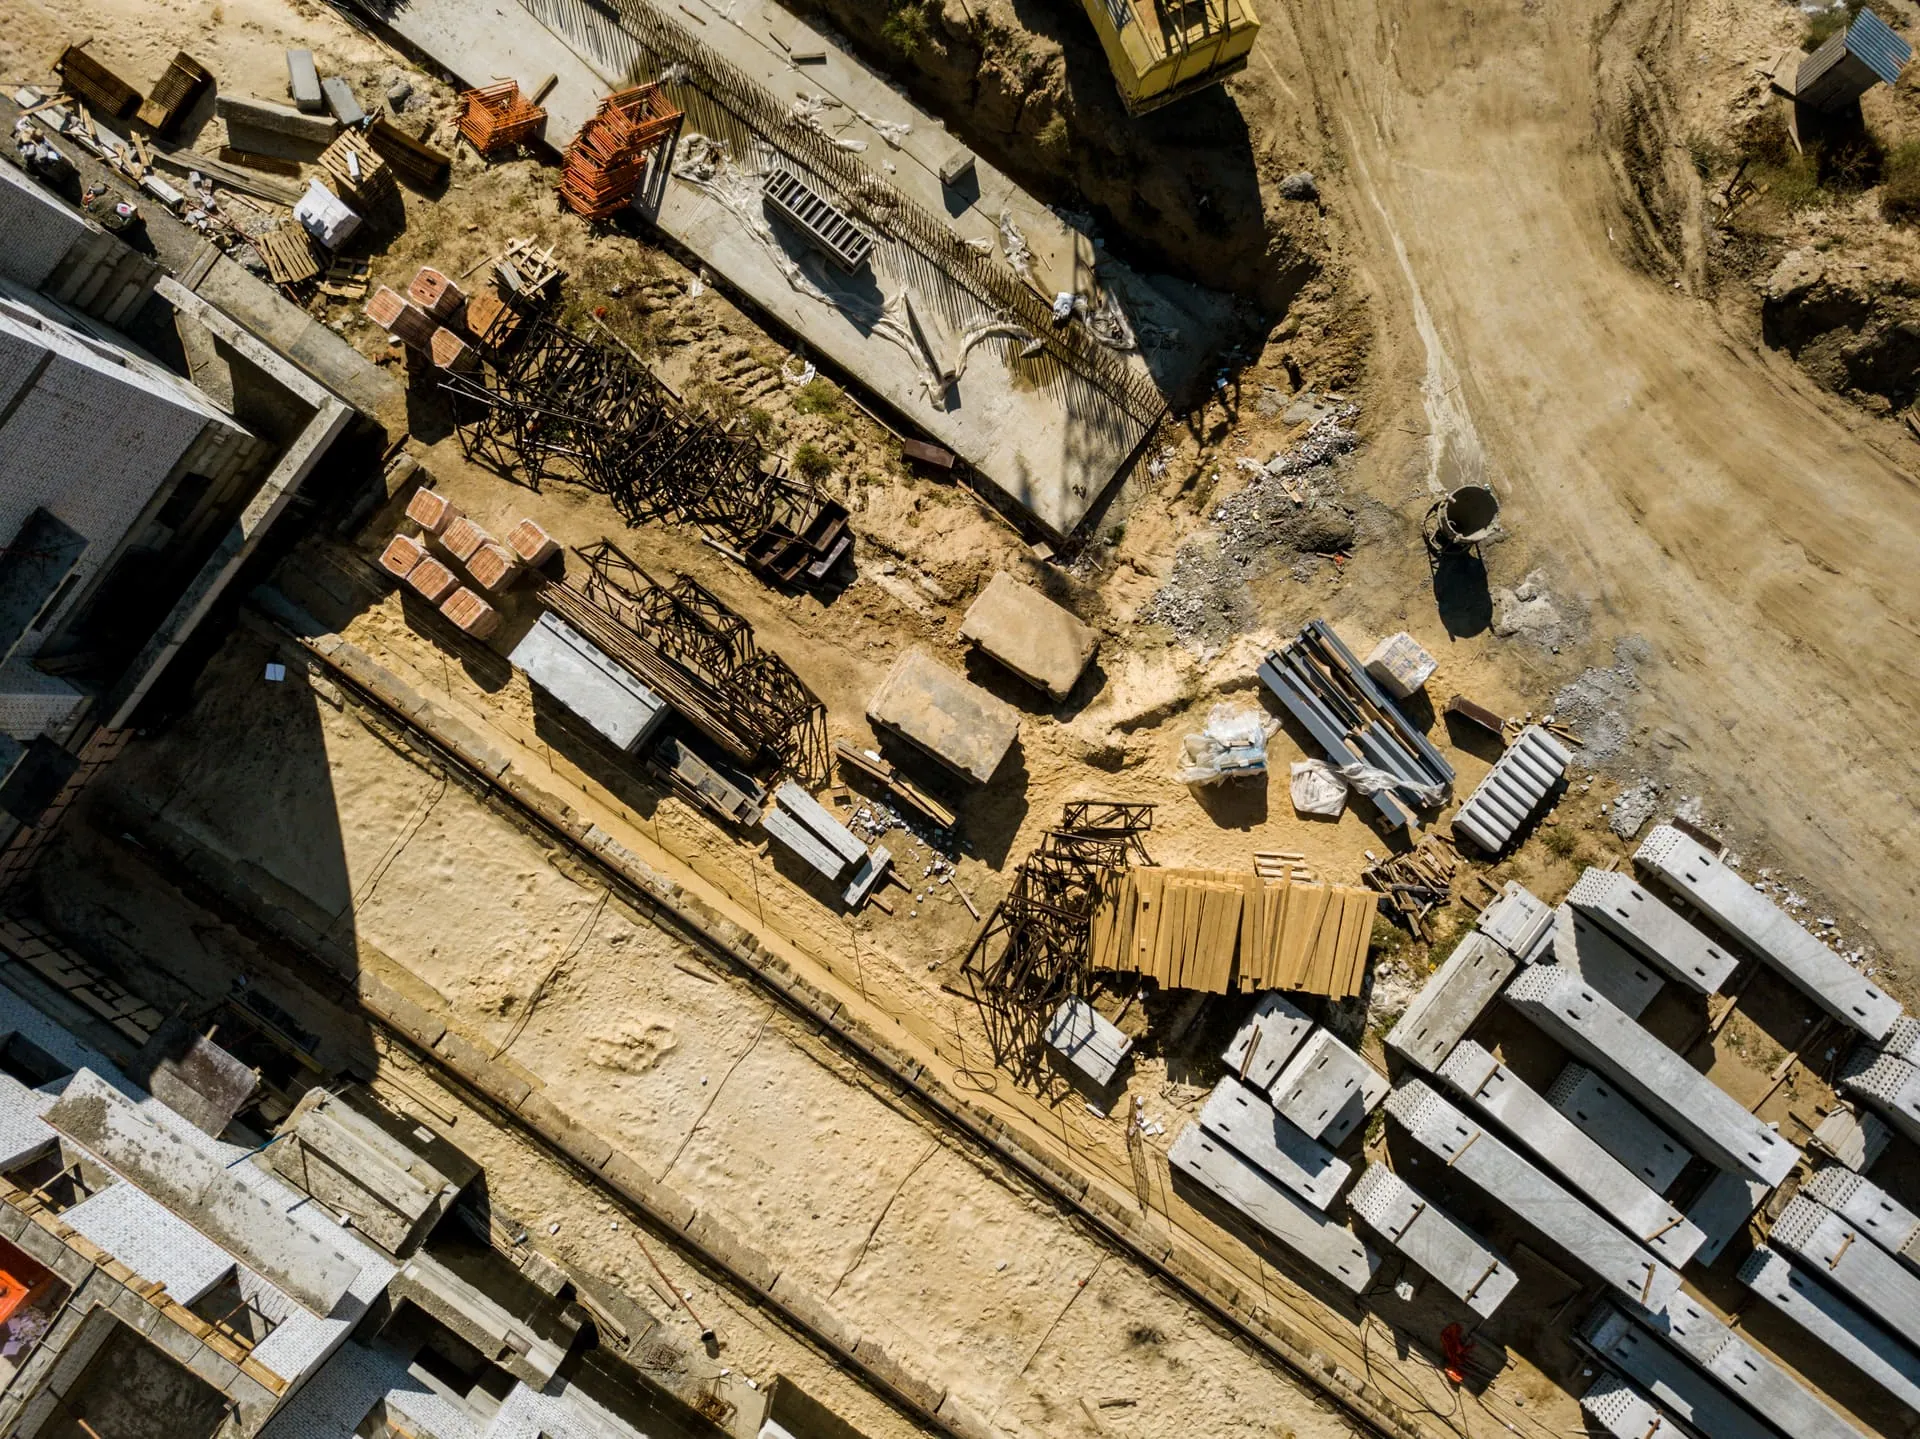
Construction
Equipment utilisation and material movement tied to the approval that releases them, so project progress and subcontractor accountability rest on site records instead of recall. Read the main contractor view.
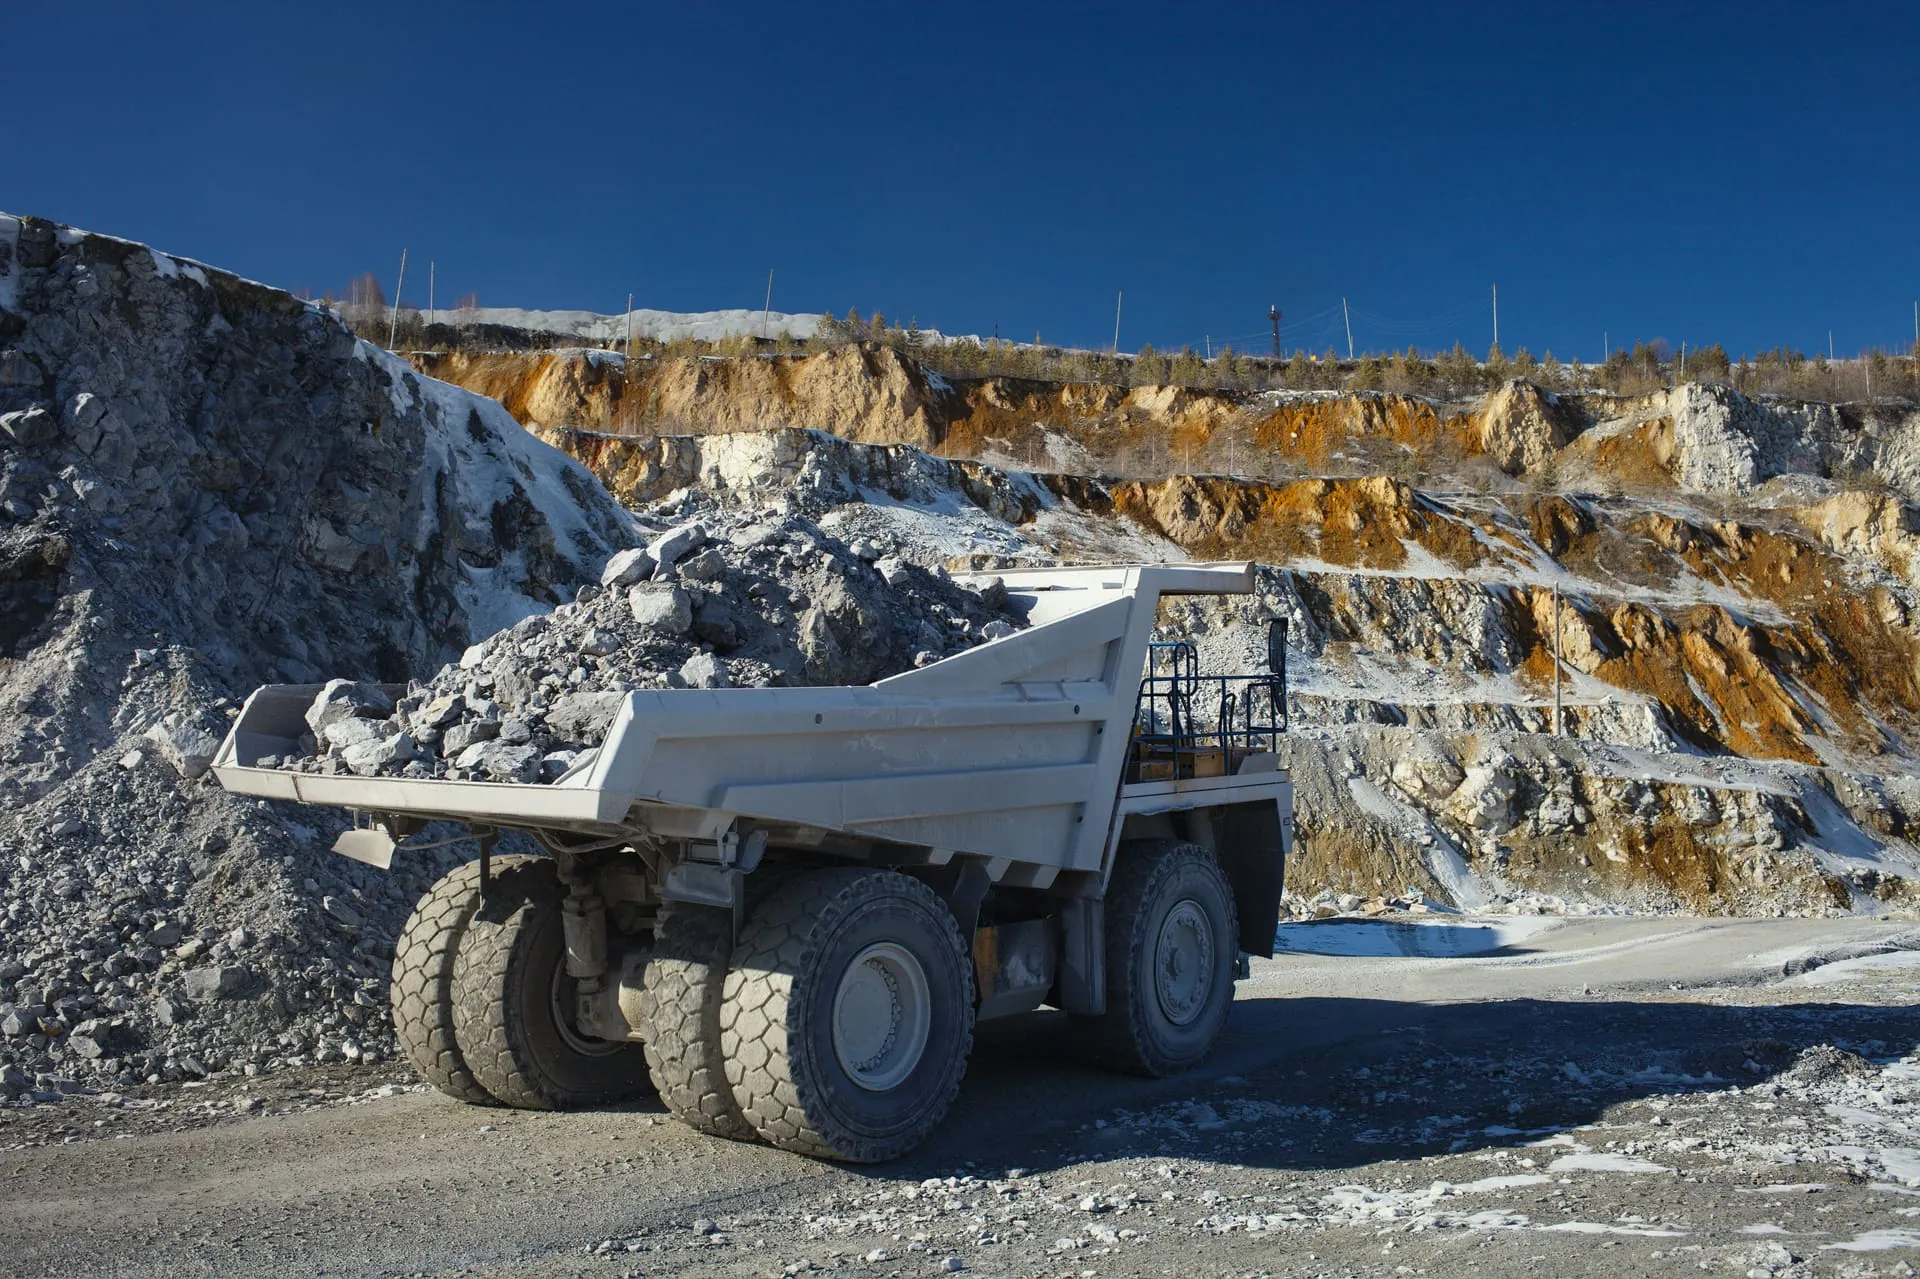
Plant Hire
Hire hours, utilisation, downtime and equipment condition captured at the machine, with operator attribution and maintenance history standing behind every deduction argument. Read the hire firm view.

Civils
Equipment activity and progress recorded at the chainage, with the measurement evidence and roadwork records that hold up in a cert review. Read the road contractor view.
By role
Who uses fleet management software
Inside a heavy fleet business the same record answers a different question at each desk.
- Managing Director
Is the fleet earning what it cost to put on the ground?
The owner reads the fleet as capital rather than as machines. Utilisation, cost against output, and the assets that repeatedly fail to earn their keep.
- Operations Manager
Which equipment is producing, waiting or unavailable today?
A live operational picture instead of a morning of phone calls. What is deployed, what is blocked, and who owns the block.
- Fleet Manager
Which assets are under-used, over-used or repeatedly unavailable?
Allocation across sites and projects, with the recurrence patterns that decide what gets moved, serviced or replaced.
- Workshop Manager
What is waiting on parts, on approval, or on a decision?
Defect to work order to parts to approval to return to service, held as one thread on the asset instead of four systems.
- Commercial Manager and QS
Can the work and the equipment activity be defended?
Timestamped, attributed evidence captured at the event and ready before the deduction or the cert review arrives.
- Finance Manager
Can the operational record support the cost and the approval?
Fuel, hours and maintenance spend tied to the asset and the job, so month-end stops being a reconstruction exercise.
What changes
What better fleet control changes
The gains are operational before they are financial. These are the changes that show up once the record is structured.
- Equipment utilisation you can act on rather than estimate
- Fewer idle hours that nobody can explain
- Fuel variance visible at the machine instead of discovered at month-end
- Operational reporting that does not wait for the shift to be rebuilt
- Accountability that holds because the record is attributed at the event
- Maintenance visibility from defect raised to return to service
- Fleet allocation decided on recurrence rather than on the loudest complaint
- Commercial evidence in hand before the dispute starts
- Audit readiness as a by-product of daily capture
What that is worth depends on the operation. Fleet size, current utilisation, the leakage already running, operational complexity, the state of existing reporting and the implementation scope all move the number. Darikoda does not publish a savings percentage and does not guarantee one. The Operational Audit puts your own figure on it, and the fuel leak calculator gives an indicative starting point on the fuel side.
Why Ghana
Why this matters in Ghana
Ghanaian sites run on mixed fleets, long distances, heavy dust and unreliable network coverage. Software built for European highways breaks down here. Darikoda is designed for the reality of West Africa: practical, offline-capable, and focused entirely on stopping the leak. The architecture explains how the record survives a dropped signal, and the Operating Notes work through the operational problems behind it.
See what this means for your operation.
A free 30-minute audit. Your priorities, a one-page leakage map and three practical next steps.
Frequently asked questions
The questions operators ask first
What is fleet management software?Read the answerClose answer
Fleet management software tells an operator what its equipment is doing, where it is, and what that activity costs. For heavy fleets it has to go further than location and cover availability, utilisation, operator attribution, hours, downtime cause, fuel and the evidence behind reported activity.
Is this just GPS tracking?Read the answerClose answer
No. GPS tracks location. Darikoda tracks operational intelligence: fuel, downtime, approvals and profitability.
How operational intelligence differs from GPS and ERPHow is Darikoda different from a traditional fleet tracker?Read the answerClose answer
A tracker is built around the asset and its position. Darikoda is built around the event and its commercial consequence. It takes telematics as an input and adds the operator, the contract, the approval, the downtime cause and the evidence a position feed does not carry.
The full comparison against ERP, trackers and spreadsheetsDoes Darikoda work for mining companies in Ghana?Read the answerClose answer
Yes. Mining is the heaviest use case on the platform, covering haul cycles, equipment utilisation, fuel integrity, production records and the operator attribution behind cost per tonne.
Mining operations in GhanaDoes it work for construction contractors?Read the answerClose answer
Yes. Construction operators use it for equipment utilisation, material movement, site records, approvals and subcontractor accountability on the same operating record.
Construction operations in GhanaCan plant hire businesses use it?Read the answerClose answer
Yes. Hire firms use it for hire hours, utilisation, downtime, equipment condition and the operator attribution that decides a deduction argument at month-end.
Plant and equipment hire in GhanaDoes it work for roadworks and civils contractors?Read the answerClose answer
Yes. Civils operators record equipment activity and progress at the chainage, with the measurement evidence that supports a cert review under FIDIC terms.
Roadworks and civils in GhanaWill it work on our remote sites when connectivity is poor?Read the answerClose answer
Yes. The system is built for offline-first field capture. Every write saves locally first and syncs when the signal returns, so a dropped signal never becomes a gap in the record.
How the record survives a dropped signalHow does fleet management software help control fuel?Read the answerClose answer
It sets fuel issued at the bowser against fuel burned at the machine and attributes both to an asset, an operator and a shift. The variance between the two is where fuel loss shows up.
Fuel management softwareHow does it help reduce unexplained downtime?Read the answerClose answer
Every downtime event carries a cause, an owner and a recovery step. That separates a breakdown from a parts delay, an approval delay or a machine with no operator, because each one needs a different fix.
Downtime tracking softwareCan it track equipment utilisation?Read the answerClose answer
Yes. Utilisation is tracked as scheduled, available, running, productive and idle hours by asset and by site, rather than as a single fleet-wide percentage that hides which machine is the problem.
Daily plant utilisation, explainedHow does it support operator accountability?Read the answerClose answer
Every logged event is attributed by PIN to the person at the point of work. That makes hours, fuel and damage records comparable between operators running similar machines in similar conditions.
How equipment damage records get attributedHow does it help with month-end reporting?Read the answerClose answer
The record is built during the shift rather than rebuilt after it. Hours, fuel, downtime and approvals are already structured and attributed when the month closes, so reporting stops being a reconstruction exercise.
The site diary as an operational recordHow does an Operational Audit work?Read the answerClose answer
It takes 30 minutes. We walk your operation, find where records, fuel, downtime, utilisation and approvals are leaking, and hand you a one-page leakage map with three prioritised fixes. You keep the map regardless of next steps.
Book the Operational AuditHow long does it take to see the leaks?Read the answerClose answer
The free 30-minute audit identifies the initial priority areas on a one-page leakage map. Once structured field capture is running, daily exceptions surface during the shift and the first full monthly reconciliation closes at the end of month one.
See where your operation leaks.
The Operational Audit takes 30 minutes. You get a one-page leakage report you keep regardless of next steps.
Patterns described here are drawn from extensive field audits and industry research across Ghana's mining, construction, roadworks, and quarry sectors. No specific operator is named or identifiable.