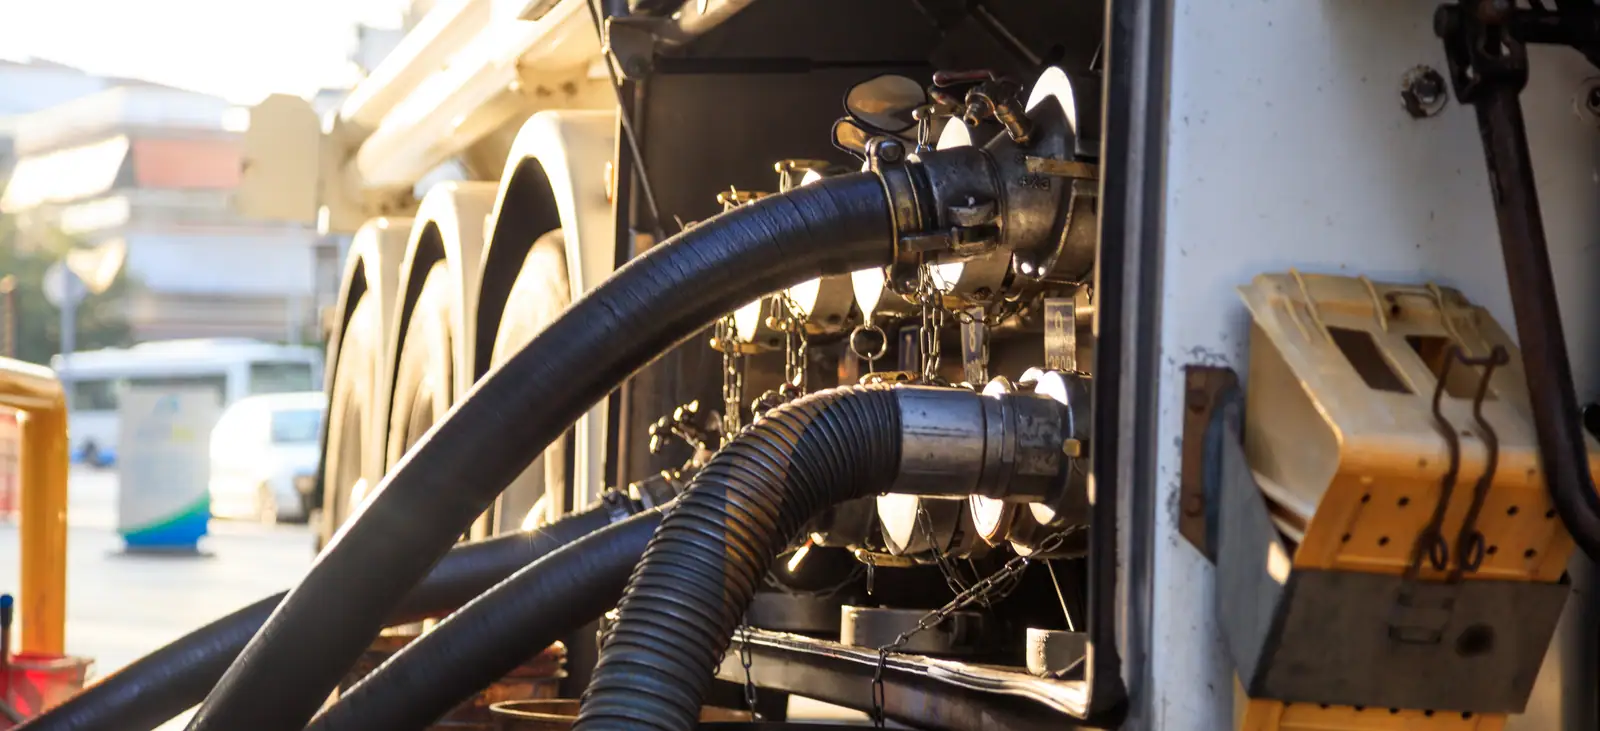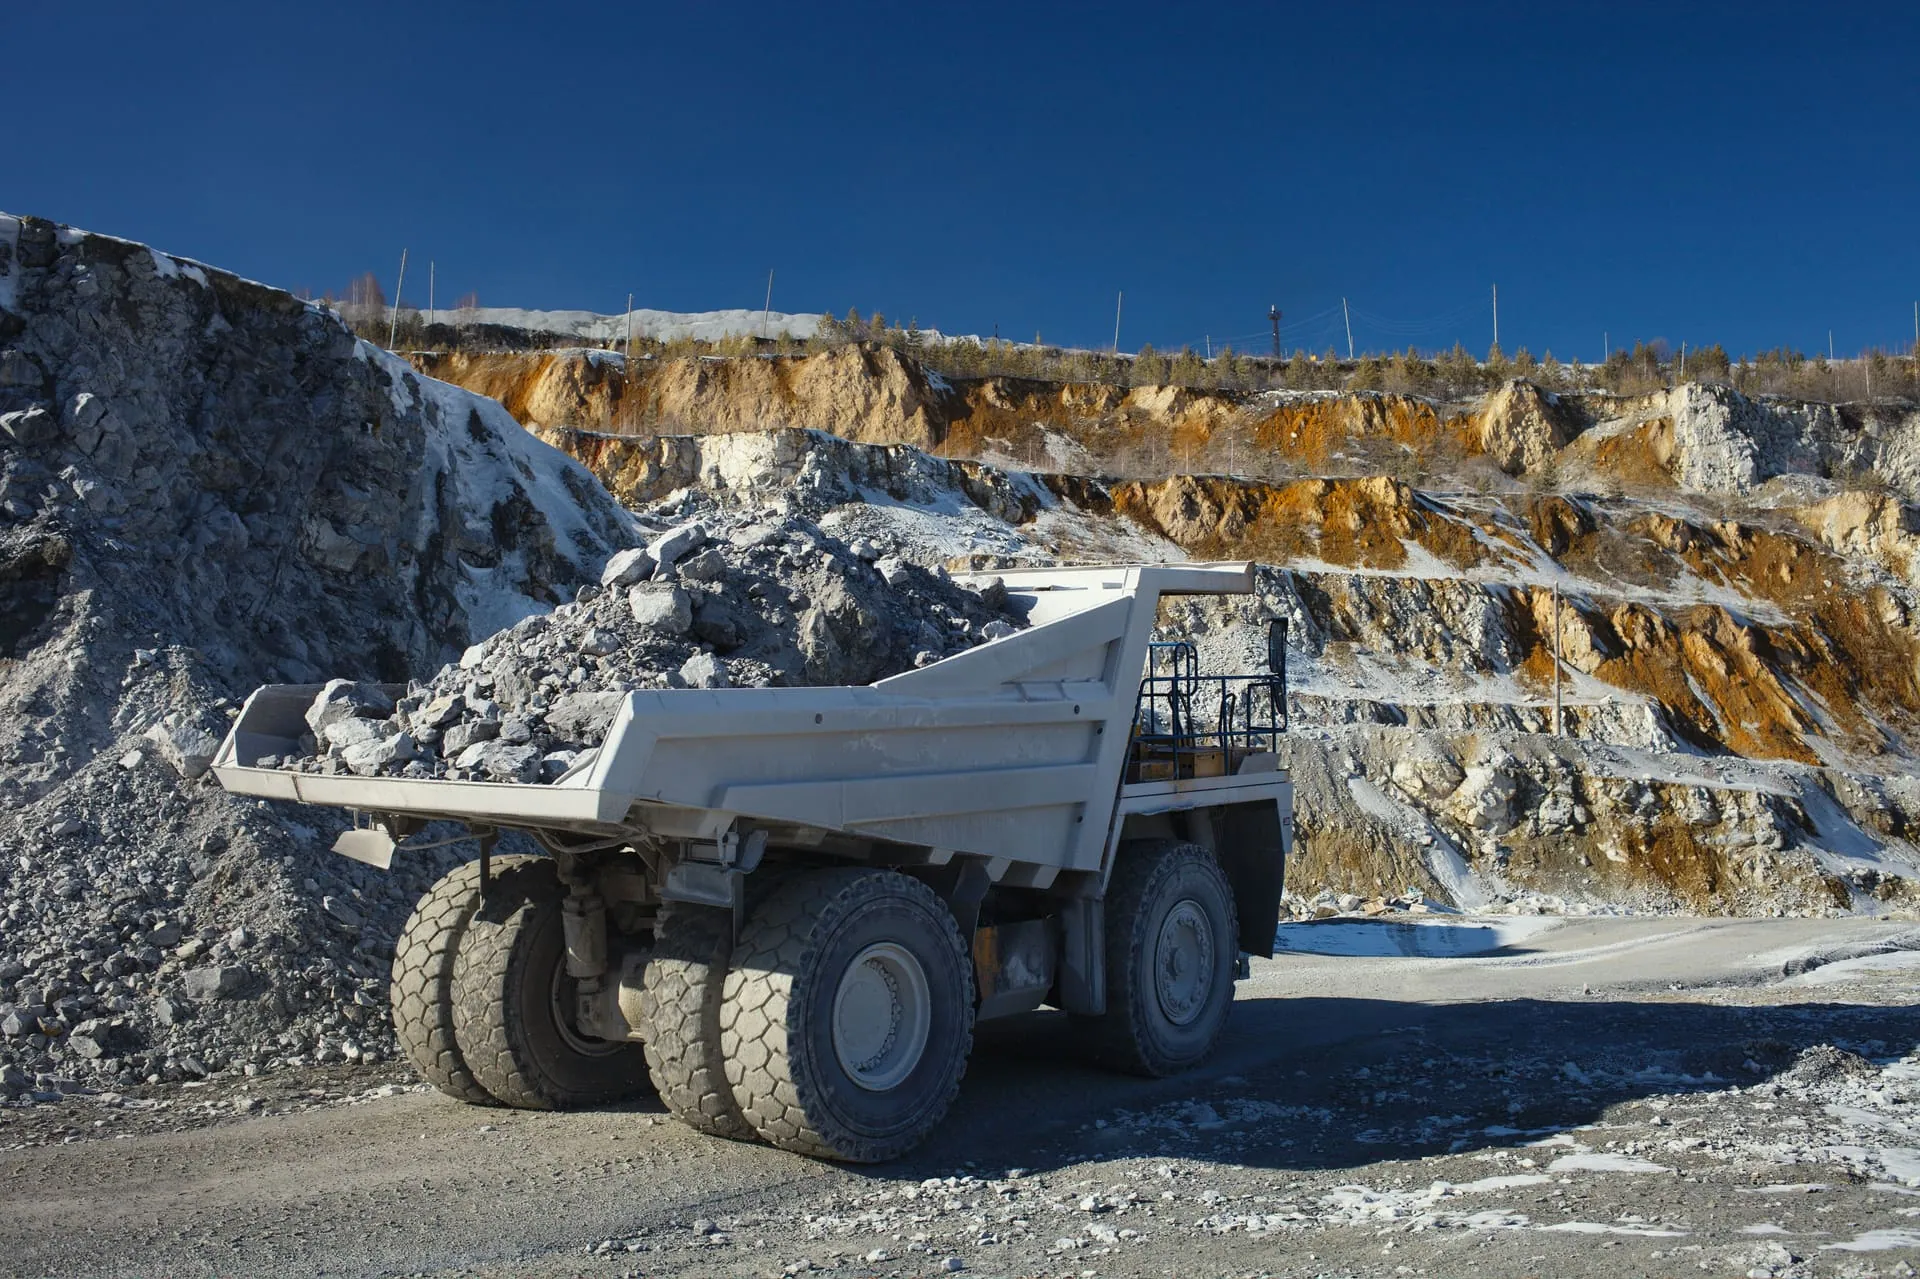
See what your diesel is leaking before you buy anything.
Fuel walks. Machines sit. Certificates drag. You feel the margin going, and the number stays fuzzy.
Enter your fleet and your diesel spend. Watch the figure at risk build line by line, on your own rates. Captured at source.
The Darikoda fuel leak calculator turns your fleet size and diesel spend into a live estimate of the cedis you lose each year to fuel loss, idle plant, downtime, and late certificates. Every rate is yours to set. The figure is illustrative until the audit grounds it in what your fleet actually shows. Captured at source.
You know it is leaking. You cannot always point at where.
Fuel that does not reconcile at the bowser. A dozer parked for a fortnight, still costing you. A certificate that clears a month late. A breakdown a service record would have caught. Each one is quiet. Together they are the margin.
This tool puts a cedi figure next to each of them, on your own rates, so the leak stops being a feeling and becomes a number you can act on.

Run your numbers
What are you leaking a year?
Set your fleet size and diesel spend. Then move every rate to what your operation actually runs. The figure at risk updates as you go.
Your operation
Every rate below is yours to change. These are the defaults, set low on purpose.
Excavators, dozers, loaders, haul trucks, graders, and other diesel plant on the fleet.
Annual diesel spend used in the model: GHS 3,600,000.
Adjust the rates. Your numbers, not ours.
Field audits where fuel is not reconciled at source commonly surface 15 to 30 percent. We default this to 5 percent. Raise it to what you see.
Hours a machine sits idle that better visibility lets you reclaim. A parked dozer and a 46 percent idle ratio are common. We default to 100.
What one idle machine-hour costs you in ownership. Default GHS 250. Use your own rate.
Breakdowns caught early by condition and hour-meter data. Default 1, deliberately low.
Parts, recovery, and lost production from one major failure. Default GHS 35,000.
At risk every year
GHS 465,000
(Illustrative model, your number from the audit.)
Fuel loss and variance
GHS 180,000
GHS 3,600,000 diesel a year x 5 percent
Money you would recover
Idle plant against ownership cost
GHS 250,000
10 assets x 100 idle hours x GHS 250 an hour
Exposure on your own rates
Downtime caught before the breakdown
GHS 35,000
1 failures caught x GHS 35,000 each
Exposure on your own rates
Each line shows the metric, your rate, and the number. No invented figure. The audit replaces every default with what your fleet actually shows.
Get your one-page leak map.
Send your numbers. Theo maps them against how the fleet actually runs and sends back a one-page leak map. It is free and it is yours to keep.
Your entered numbers go with this: Mining, 10 assets, GHS 3,600,000 annual diesel, GHS 465,000 at risk on your own rates.

Our defaults are set low. Yours will be higher.
We would rather show you a conservative number you cannot argue with than a scary one you will not believe. Raise every rate to what your own fleet shows.
Where each number comes from
Every figure shows its bridge.
No invented dollar. Each line is a metric your operation produces, a rate you control, and the number that falls out. We label how hard each one is to defend.
Money you would recover
Fuel loss and variance.
Your annual diesel spend against the share that goes missing between the bowser and the machine. We default the loss rate to 5 percent. Field audits where fuel is not reconciled at source commonly surface 15 to 30 percent.
Exposure on your own rates
Idle plant against ownership cost.
Addressable idle hours per machine times what an idle machine-hour costs you to own. A parked dozer still burns money. Reclaim the hours and the cost comes back.
Exposure on your own rates
Downtime caught before the breakdown.
Major failures caught early by hour-meter and condition data times the cost of one failure in parts, recovery, and lost production. We default to one failure a year, deliberately low.
Exposure on your own rates
Retention and late-cert capital.
For construction and civils, the cash tied up in retention and certificates waiting to clear times your cost of capital. Late money is expensive money.
A measured figure, not a model
On one pilot fleet, 1,038 idle machine-hours mapped to GHS 259,500 at the operator's own ownership rate. That number came off the hour-meters, not a slider.

How we label certainty
A CFO can attack a made-up number. Not a measured one.
Every figure tells you exactly how firm it is before you take it to the board.
Money you would actually recover.
Cash that moves back to you. Fuel recovered, variations billed. No guesswork behind it.
Exposure we would estimate with you, from your own rates.
A real number your fleet already produces, times a rate you set. Idle hours times your ownership cost. A figure you can take to the board and defend.
What we would simply show you.
The count itself, where no single figure is worth arguing. Every fuel event captured at source, one to one, with GPS and photo.
Turn the estimate into a leak map.
Send your numbers and Theo maps them against how your fleet actually runs. You get a one-page leak map with the three fixes worth chasing first, ranked by recovery. It is free, and it is yours to keep whether or not you go further.
Calculator FAQ.
How accurate is the calculator?
It is an honest estimate, not a promise. Every rate starts on a conservative default and you replace it with your own number. The output stays illustrative until the free audit grounds it in what your fleet actually shows.
Where do the default rates come from?
From the value framework Darikoda uses in the field. Ownership cost defaults to GHS 250 an idle hour, a prevented failure to GHS 35,000, cost of capital to 24 percent a year. Fuel loss defaults to 5 percent, well below the 15 to 30 percent that field audits commonly surface where fuel is not reconciled at source. Change any of them to your own figure.
Do you store my numbers?
Your numbers reach Theo only when you choose to send them for a leak map. Nothing is stored or shared otherwise. No specific operator is ever named or identifiable in anything Darikoda publishes.
What is the difference between this and the audit?
The calculator is a self-serve estimate you run in a minute. The audit is a free 30-minute conversation with Theo that produces a one-page leak map for your operation, with three prioritised fixes you keep regardless of next steps.
What size fleet is this for?
It varies by vertical, not by a fixed fleet size. Mining contractors can qualify from around 3 heavy assets. Plant hire firms from around 20. Construction and civils main contractors often run 50 or more across projects. The common thread is fuel exposure or contract structure that justifies operational intelligence.
Put a number on the leak.
The estimate is free and the leak map is yours to keep. Start with your own numbers.
Patterns described here are drawn from extensive field audits and industry research across Ghana's mining, construction, roadworks, and quarry sectors. No specific operator is named or identifiable.