Know what the crew actually worked on.
The old way
Headcounts and updates arrive without a clear link to the work area.
With a connected operating record
Record who worked, where and on what during the site day.
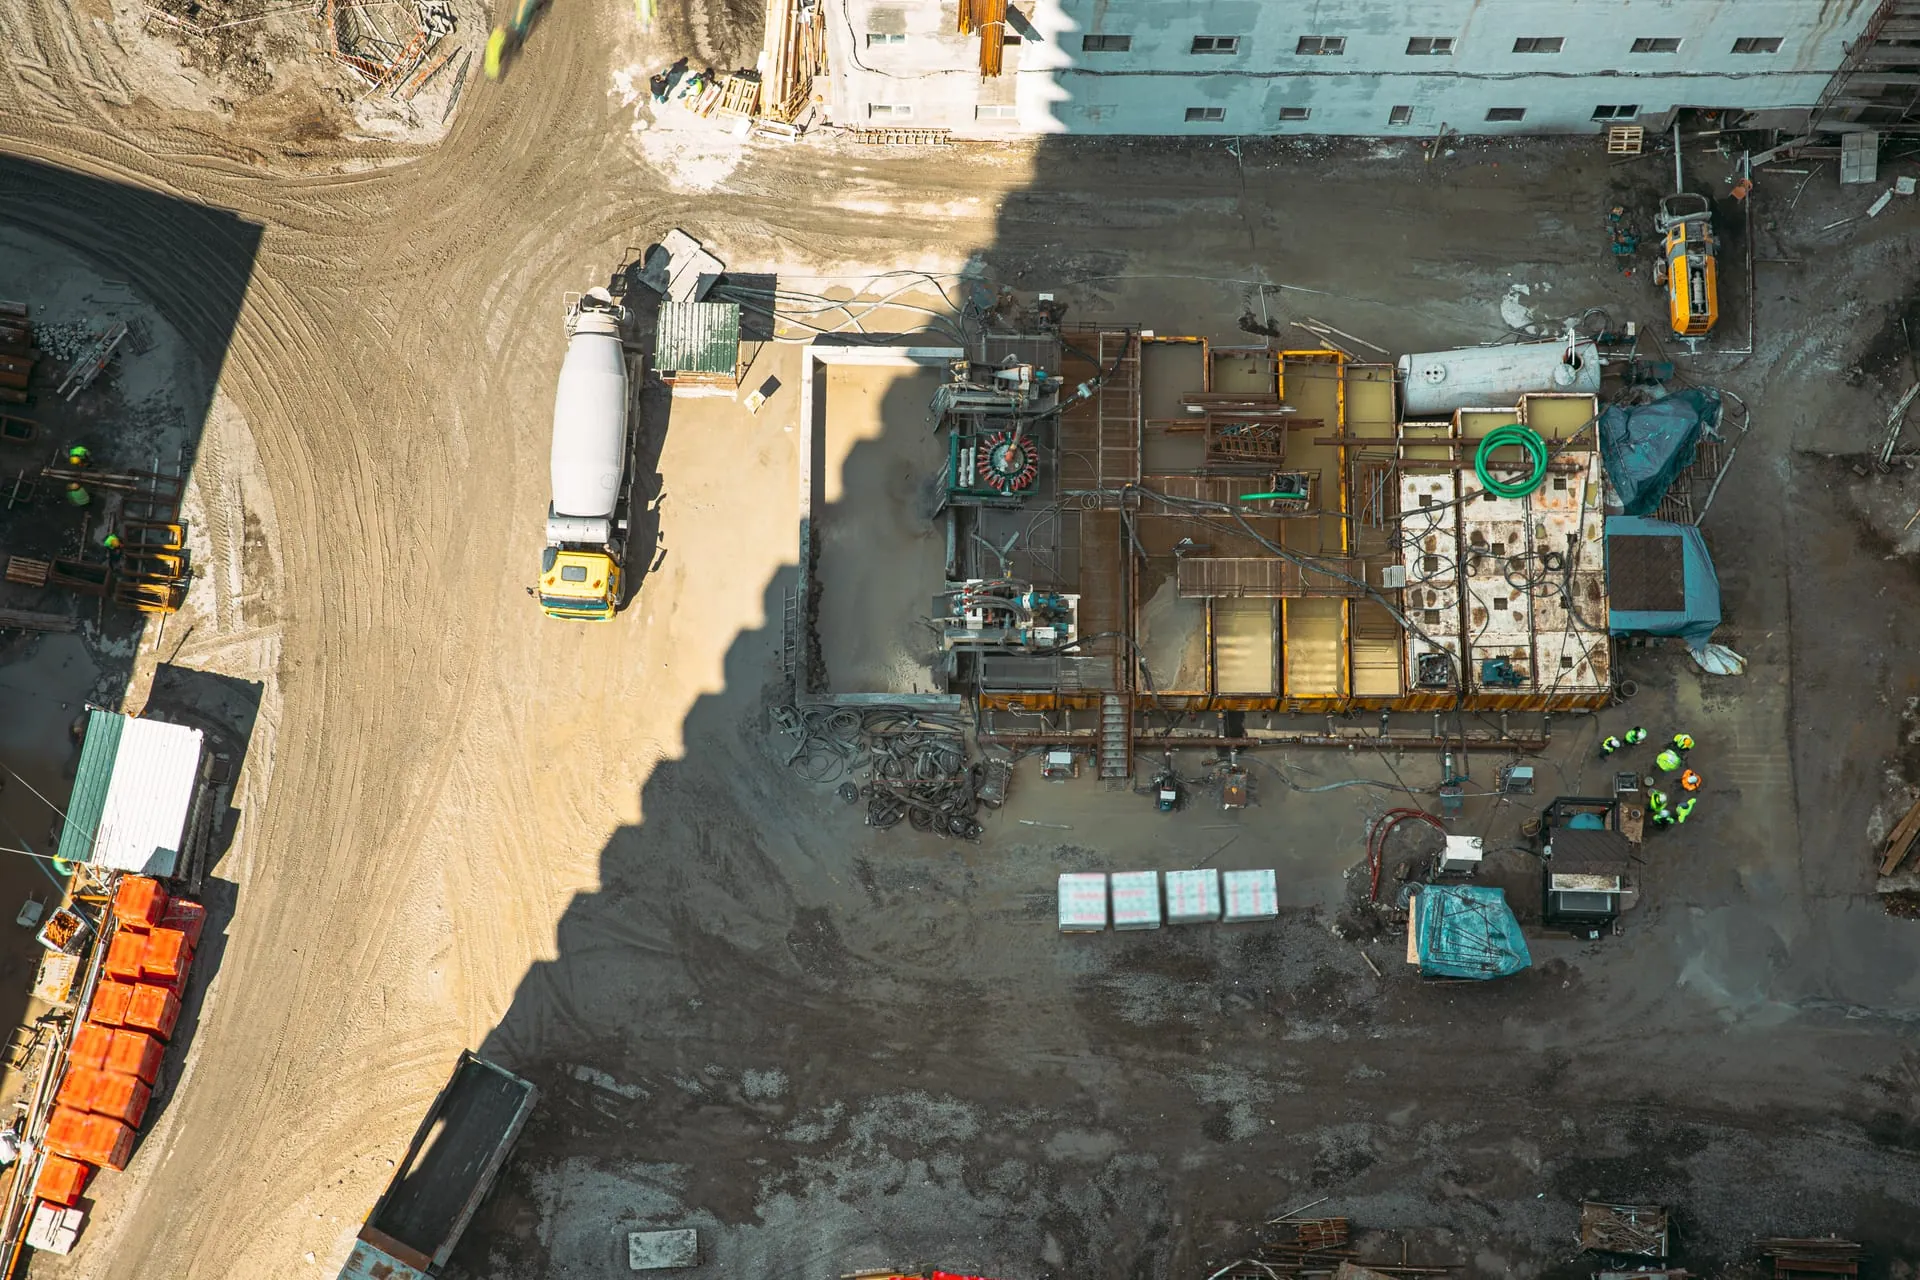
Darikoda · Construction Operations Ghana
Compare daily progress with the crews and plant behind it.
Crews
Work recorded
Who worked, where and on what
Plant
Hours attached
The asset behind the activity
Progress
Quantity checked
Compare the result with the plan
Connect resources to the work recorded that day, then inspect the supporting evidence.
Three roles. Three versions of the same gap.
Darikoda is the operating record that closes the time gap between site reality and head office. Per-project profitability, materials variance, subcontractor performance, per-cubic-metre cost. Captured at source.
USD 285,000
BMoney at risk from time, Parkview Phase 2
Control framing, never over budget. The schedule slip is what puts the money at risk.
Spend ratio, EAC
C108%
Forecast profit
C-USD 115,000
Margin erosion
B-USD 287,000
Worst unit margin
B-USD 84,300
Best unit margin
B+USD 472k
Materials vs BoQ
B7%
Parkview Phase 2
SPI 0.79CSPI 0.79, 19 days late. USD 132,000 exposure on the flagged phase, driving the loss.
See what changes
Read the site day in one place.
Headcounts and updates arrive without a clear link to the work area.
Record who worked, where and on what during the site day.
Machine hours and progress sit in separate reports.
Attach the asset hours to the activity they supported.
A headline percentage hides the work behind it.
Inspect the recorded quantity and supporting evidence before accepting the summary.
Connect resources to the work recorded that day, then inspect the supporting evidence.
At a glance
Darikoda gives Ghana developers, main contractors, and construction subcontractors structured operating evidence for per-project profitability, materials variance, approval cycles, and IPC defence. Captured at source.
In 30 seconds
Best fit: developers and main contractors running several projects, where materials variance, subcontractor deductions or margin drift hide inside the portfolio average.
Weak fit: single-project builders small enough that one site manager still sees every cost as it happens.
Pick your specialisation
This vertical splits into specialisations. Pick the seat that matches yours. Each view is written for it, not adapted from a generic one.
Two versions of reality. What the project is actually doing: operators on machines, materials in stockyards, subcontractors on sections, approvals waiting on phones. What head office sees: a finance report Monday morning, a WhatsApp update Wednesday, a Friday review of last week.
The developer is too late to protect delivery date and buyer trust. The main contractor is too late to protect IPC and margin. The subcontractor is too late to defend work done and deductions. Same gap. Three positions. The role decides which margin you lose first.
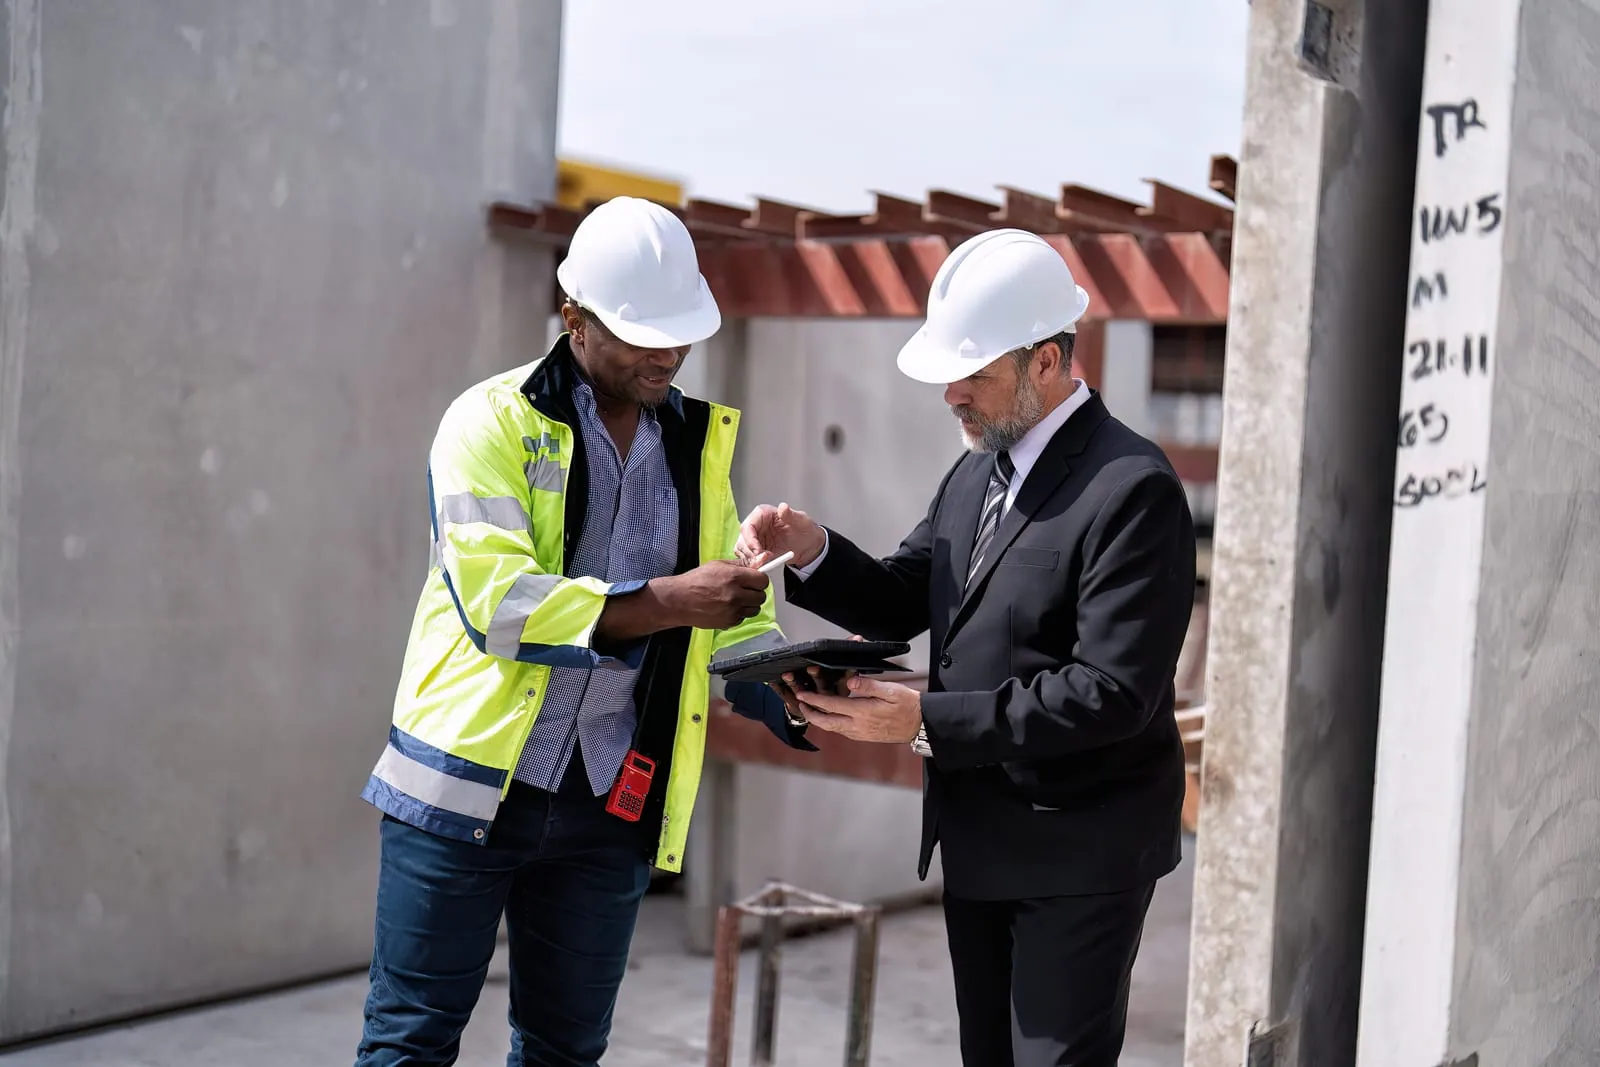
The margin is made on site and lost in the lag to head office. The record closes the gap between what happened and what the office can still act on.
What surfaces
Monday morning finance report shows Project A profitable, Project B middling, Project C bleeding.
What doesn't
Project A is profitable because two operators carry it. Project B is bleeding the same way Project A would be if either of them left.
What surfaces
BoQ records 1,800 tonnes of aggregate delivered to Block A.
What doesn't
540 tonnes became Block A structure. 1,260 tonnes are unaccounted at month-end. Three weeks too late to intervene.
What surfaces
Off-plan buyer's delivery date moves from 30 September to 15 December.
What doesn't
The operational evidence said September wasn't survivable in June. The buyer found out in August. The refund clause activates in October.
What surfaces
Cert submitted to consultant for Phase 1 Block C, GHS 4.2M claimed.
What doesn't
The consultant cuts GHS 265,000 because three weeks of cube tests are missing from the evidence pack. You absorb it.
What surfaces
Site dashboard shows 8% margin on the development overall.
What doesn't
Block B alone is at -3%. Aggregate margin hides it for another quarter.

By the time the numbers reach finance, the work has already moved on.
The gap shows up differently depending on your seat. The main contractor files an IPC three weeks after the work. The developer sees a profitability number that already absorbed the variance. The subcontractor gets a month-end deduction with no evidence to dispute it. Same gap, three commercial consequences.

Reconstruct it at month-end and the consultant cuts it. Capture it on the day, at the chainage, and it holds.
ARCHETYPE 1 · MAIN CONTRACTOR (LEAD)
You win the contract from the developer or the government. You own the fleet. You run the site. You subcontract specific labour or specialised work. 100 to 2,000 assets across multiple projects. Contract structure usually FIDIC red book, some yellow book, some lump-sum.
What you care about

Role-routed by design.
Mid-market operators distrust dashboards that show everything to everyone. So Darikoda role-routes: workshop sees workshop, finance sees finance, GM sees the exception roll-up, director sees the briefing.
The approval bottleneck.
At main contractor scale (50+ assets, multiple projects), the truth gap compounds through approval friction. The GM processes hundreds of daily decisions on parts, machine moves, fuel orders, exceptions, through phone calls and WhatsApp. Machines sit idle for weeks because no one at head office had visibility on what was free where.
Darikoda surfaces the cost of an approval delay in real time, on the GM's phone, prioritised by financial impact. The decision still happens. It happens with the data.
Many main contractors are also internal plant hire firms.
On road and civils projects, the main contractor owns the equipment but rents it to specialist subcontractors. The contractor charges by machine hours, supplies the fuel, deducts both from the subcontractor's monthly payment.
When the paper timesheet is challenged at month-end, the contractor loses revenue or absorbs cost. Operators work for the subcontractor, but the fleet owner stays close to them: poor care of the machine shows up in the fleet owner's costs later. You can remove a bad operator from your machine, but not from the subcontractor's payroll. The leverage is real but partial.
Buyer language we hear: "internal cross-hire", "deductions from the sub's IPC", "supplied fuel against payment", "we supply the machine, they dispute the hours".
Proof point
Role-routed dashboards plus cert preparation that takes 2 people 1 week instead of 10 people 1 month.

Approvals, variations, deductions: decided in the field and on WhatsApp, and lost before they reach the office record.
ARCHETYPE 2 · REAL ESTATE DEVELOPER
You own the project. You hire the contractors. You sell off-plan or completed homes. Mid-market in Ghana, 50 to 500 unit projects. Single-project or portfolio.
Published buyer guidance in Ghana increasingly emphasises legal certainty, financial resilience, execution track record, quality assurance, and post-acquisition support. Buyers verify GREDA membership, REAC licensing under the Real Estate Agency Act (Act 1047, firm registration open since November 2025), AMA permits, EPA compliance, material certifications as standard due diligence. The developer's operational record is now part of how the buyer evaluates the developer. Source: Ghana Real Estate Developer Guide 2025-2026.
Real estate developers want to see everything in real time. They want efficiency, planning, coordination, and detailed transparency across every department on every project. They normally cannot see what is happening until it is already too late.
Till it's too late.
Late is not "slightly behind schedule". Late is the buyer ringing about the delivery date you promised while your operations team scrambles for an answer. Late is the budget already overspent before head office sees the variance. Late is the consultant's cert cuts arriving while your evidence is still in three WhatsApp threads.
The eight specific pains developers carry
Different performance on different projects.
Cost and time efficiency vary site to site. The developer with five active projects usually has two healthy, two middling, one bleeding. The aggregate makes the portfolio look balanced. The bleeder hides until quarterly review.
Darikoda surfaces per-project profitability side by side, so the bleeder shows up the moment it diverges, not three months later.
Performance tied to individuals, not the team.
A site might be hitting numbers because two of five operators carry the rest. The team average hides this.
Darikoda's attribution layer shows where performance is really coming from, per operator, supervisor, machine, shift, project. Fairer basis for coaching and recognition than team averages.
Legal disputes.
With the consultant on cert measurement. With subcontractors on disputed hours and deductions. With off-plan buyers on missed delivery. The party with weaker evidence loses.
Darikoda's immutable, time-stamped, attributed audit trail is the record that survives in dispute.
Customer refunds triggered by missed delivery.
The off-plan buyer signed a contract with a delivery date. The date slips. The developer's defence is operational evidence, was the slip foreseeable, was it managed.
Darikoda surfaces earlier warning when operating evidence no longer supports the delivery date. Time to intervene before the buyer relationship breaks.
Stolen materials.
100 tonnes delivered. 70 tonnes became structure. 30 tonnes vanished. Currently the variance shows up only at month-end.
Darikoda's material consumption truth at section level surfaces variance the day it appears, not the month after.
Materials shortfall.
Wrong amount ordered. BoQ assumptions off. Supplier under-delivered. Work stops. Crew sits idle. Schedule slips.
Darikoda links material consumption to BoQ and work front. Shortfall surfaces before the crew arrives at an empty stockpile.
Many stakeholders, no real-time visibility.
Architects, engineers, contractors, subs, suppliers, finance, sales, regulators. Each gets a different version filtered through different people.
Darikoda's role-routed dashboards give each stakeholder their slice from the same record. Same source, different cuts.
Cost per cubic metre to manage sales and margins.
Without it, sales pricing is guesswork and margin protection is reactive.
Darikoda's cost-per-output attribution (per cubic metre, tonne, linear metre, home unit) is live, project-specific, updated as work happens.
Their language
Phase 1, phase 2, block A, block B, off-plan buyers, completion date, snagging, contractor variation order, BoQ overrun, GREDA, Lands Commission registration, AMA permit, EPA compliance, escrow account, "see what's happening before it's too late", "every department in real time", "cost per cubic metre", "the buyer is asking", "we have a refund clause", "different sites different stories".
Proof point
A live dashboard the developer's finance director or COO can open at any moment and see: budget vs actual on every active section, material consumption variance, subcontractor performance, projected delivery dates with operational evidence beneath each one, and per-cubic-metre cost across every project side by side. Not a Monday-morning report. A real-time record that closes the time gap between site reality and decision-making, before the news becomes bad news.
ARCHETYPE 3 · SUBCONTRACTOR
Earthworks, concrete, finishing, MEP, mechanical, labour-only. 5 to 30 assets if equipped, or no fleet if labour-only. Paid per measurement, per day, or lump sum.
The proof point is simple: a defendable log of work done you can hand to the main's QS at month-end. Time-stamped. Attributed. No reconstruction. The hours you worked, the metres you laid, the tonnes you placed are the hours, metres, and tonnes that get billed.
02 / The platform · applied to construction
The same operating-record logic that runs underneath every Darikoda deployment, surfaced in construction's native vocabulary.
The variance shows up the day it appears, not the month after.
100 tonnes delivered. 70 tonnes became structure. 30 tonnes vanished. The variance shows up the day it appears, not the month after.
Phase 2 of the next development gets a defensible BoQ because phase 1 evidence is already in the record. 20 to 30 day reduction in detection latency vs month-end reconciliation.
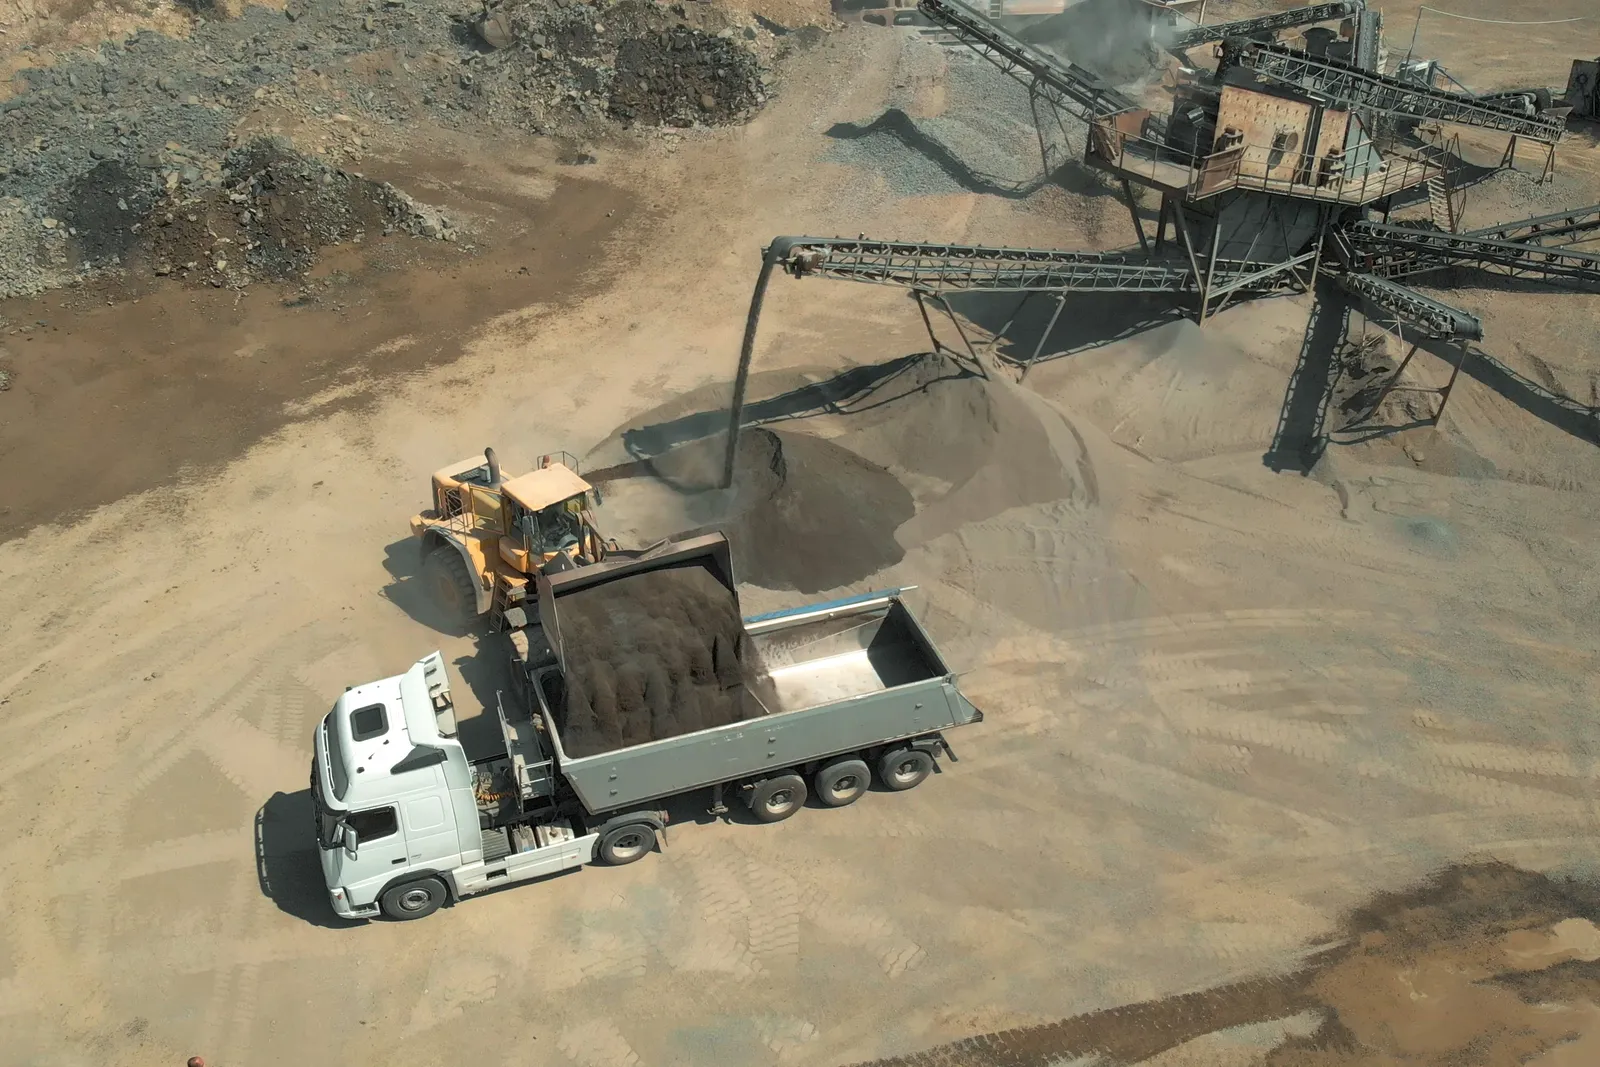
Independent measurement of each subcontractor's work. Fuel and material attribution where you supply them. A defendable trail when the deduction is challenged. Same source: main contractor sees the aggregate, each sub sees their own slice.
The GM processes hundreds of daily approvals through phone and WhatsApp. Each carries a cost only visible when the consequence arrives: an idle machine, an unstarted section, a fuel order that didn't ship. Darikoda surfaces the cost of an approval delay in real time, prioritised by financial impact. An approval that used to sit for hours can clear in seconds once the cost of waiting is on screen. The decision still happens. It happens with the data.

Ordered, delivered, issued, poured. The variance surfaces weeks later, by which time the crew and the cost have moved on.
Worked scenarios illustrate the mechanism, not published customer outcomes. (Illustrative model, your number from the audit.)
Old way
Quarterly review shows 8% portfolio margin. Comfortable. Three months later, Block B's reconciliation arrives at -3%. The portfolio average had been hiding it for a full quarter.
On Darikoda
Per-project profitability surfaces live. Block B diverges from the portfolio average in week three of the quarter, not at quarterly review. The intervention window opens 10 weeks earlier.
10 weeks earlier
is the intervention window that opens when per-project profit surfaces live, instead of hiding in the portfolio average until quarterly review.
Old way
1,800 tonnes aggregate delivered to Block A. The variance shows up at month-end reconciliation. 1,260 tonnes unaccounted. The supplier dispute begins. The site is already on the next phase.
On Darikoda
Material consumption captured at the section. Variance against the BoQ surfaces the day it appears. The intervention happens before the next delivery is ordered, not three weeks after the fact.
Same-day
variance surfaces vs month-end. 20 to 30 day reduction in detection latency.
Old way
GM gets the part-order approval request at 11:47am via WhatsApp. Responds at 3:14pm because of an unrelated meeting. Machine sits idle for the rest of the day. Cost is invisible.
On Darikoda
Approval lands on the GM's phone with the financial impact attached. GM sees that the delay costs GHS 47K in idle-machine time. The decision happens with the data.
Seconds, not hours
is what an approval becomes once the cost of waiting is on screen. The cost of delay shows up before it is incurred, not after.

The evidence captured at inspection is the same evidence that defends the certificate when the consultant arrives.
Contract environment
FIDIC red book. Joint measurement. BoQ-aligned cost tracking. Variation orders documented at the moment, not three months later. Cert prep with 2 people for 1 week instead of 10 people for 1 month. The contract environment shaped the operating record, not the other way around.
Free 30-minute audit on WhatsApp. A one-page leakage map for your projects. You keep it either way.
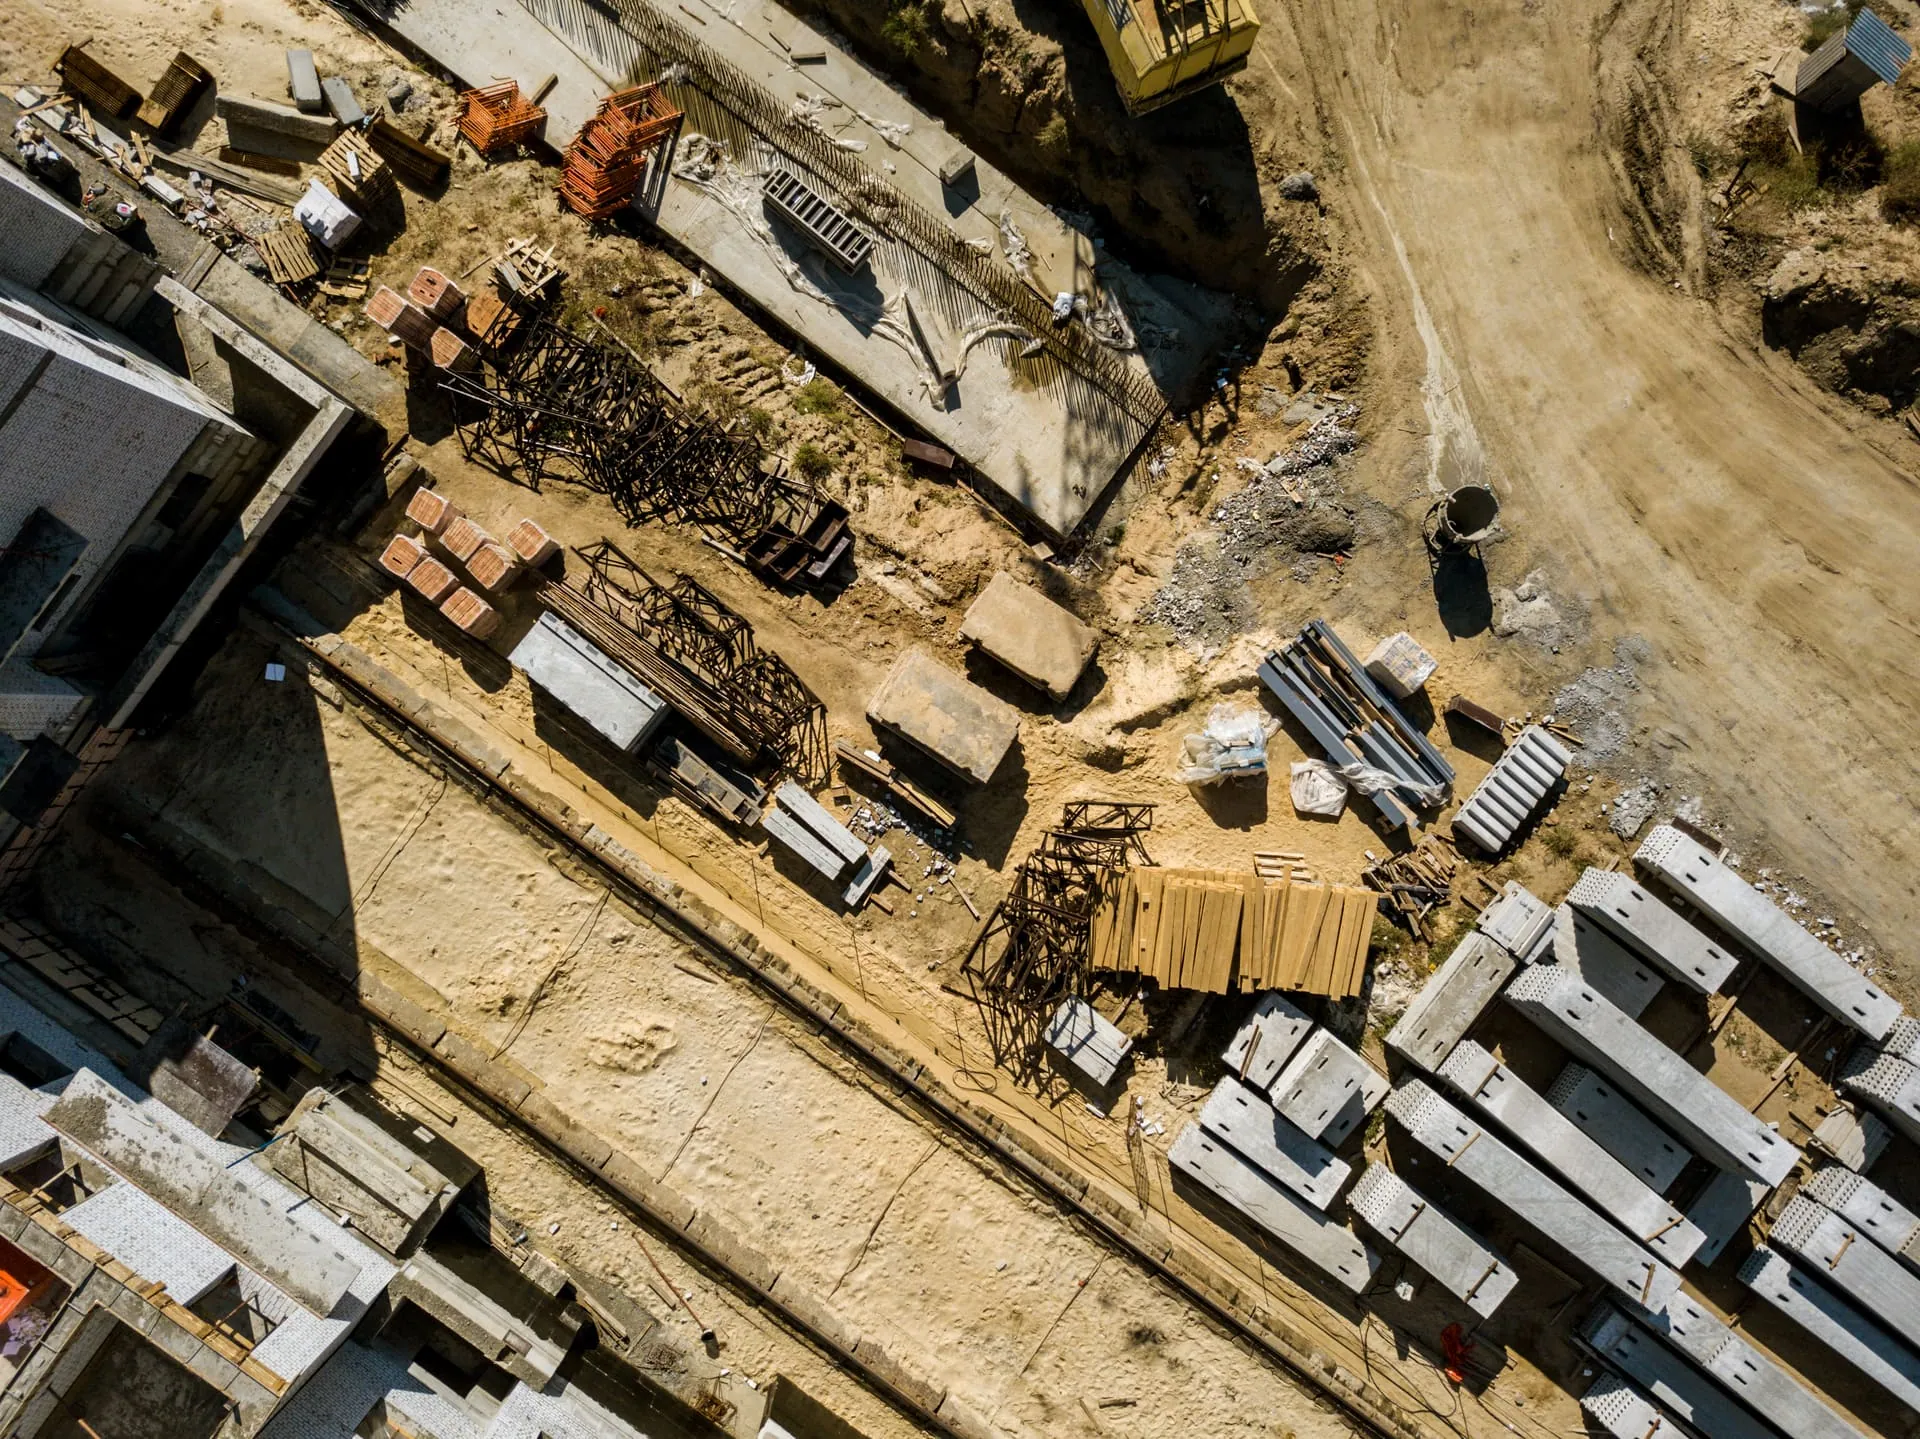
The record holds from the section to the head-office review.
Cross-vertical reach
The internal cross-hire dynamic, where you own the equipment, supply fuel, and deduct both from the subcontractor's payment, is a substantial part of how Ghana road and civils projects actually run. If that's part of your operating model, the deduction-game framing on the Plant Hire & Fleet Owners page applies directly.
Common questions from developers, main contractors, and subcontractors.
Property developers, main contractors and subcontractors in Ghana, including projects in Accra, Kumasi and Takoradi. Each has a different concern: delivery and overall cost, managing the build, or supporting a payment claim. The guides above explain each use.
Compare recorded deliveries with material use and supporting records. When the quantities differ, managers can check the relevant entries and follow up with the site team.
Darikoda records measured work against project items and supports interim payment certificates, often called IPCs. The quantities and supporting records give the team the detail needed to review what is being claimed.
The app records blockers such as materials or design decisions and shows them alongside planned work. Managers can review the open issue and follow up on what is needed before the task can proceed.
Machine hours and equipment use are recorded against the project, so managers can review what the fleet is costing a site rather than reading one figure across the portfolio.
How fleet records workYes. Keep your existing finance system for accounting. Darikoda adds the site records behind the figures, including project activity, measurements, materials and equipment use.
How Darikoda fits with existing systemsFrom the Operating Notes
The Operational Audit takes 30 minutes. You get a one-page leakage report, construction-specific, that you keep regardless of next steps.
Patterns described here are drawn from extensive field audits and industry research across Ghana's mining, construction, roadworks, and quarry sectors. No specific operator is named or identifiable.