DARIKODA

Operational intelligence

Real estate developers in Ghana: protect the delivery date and the margin

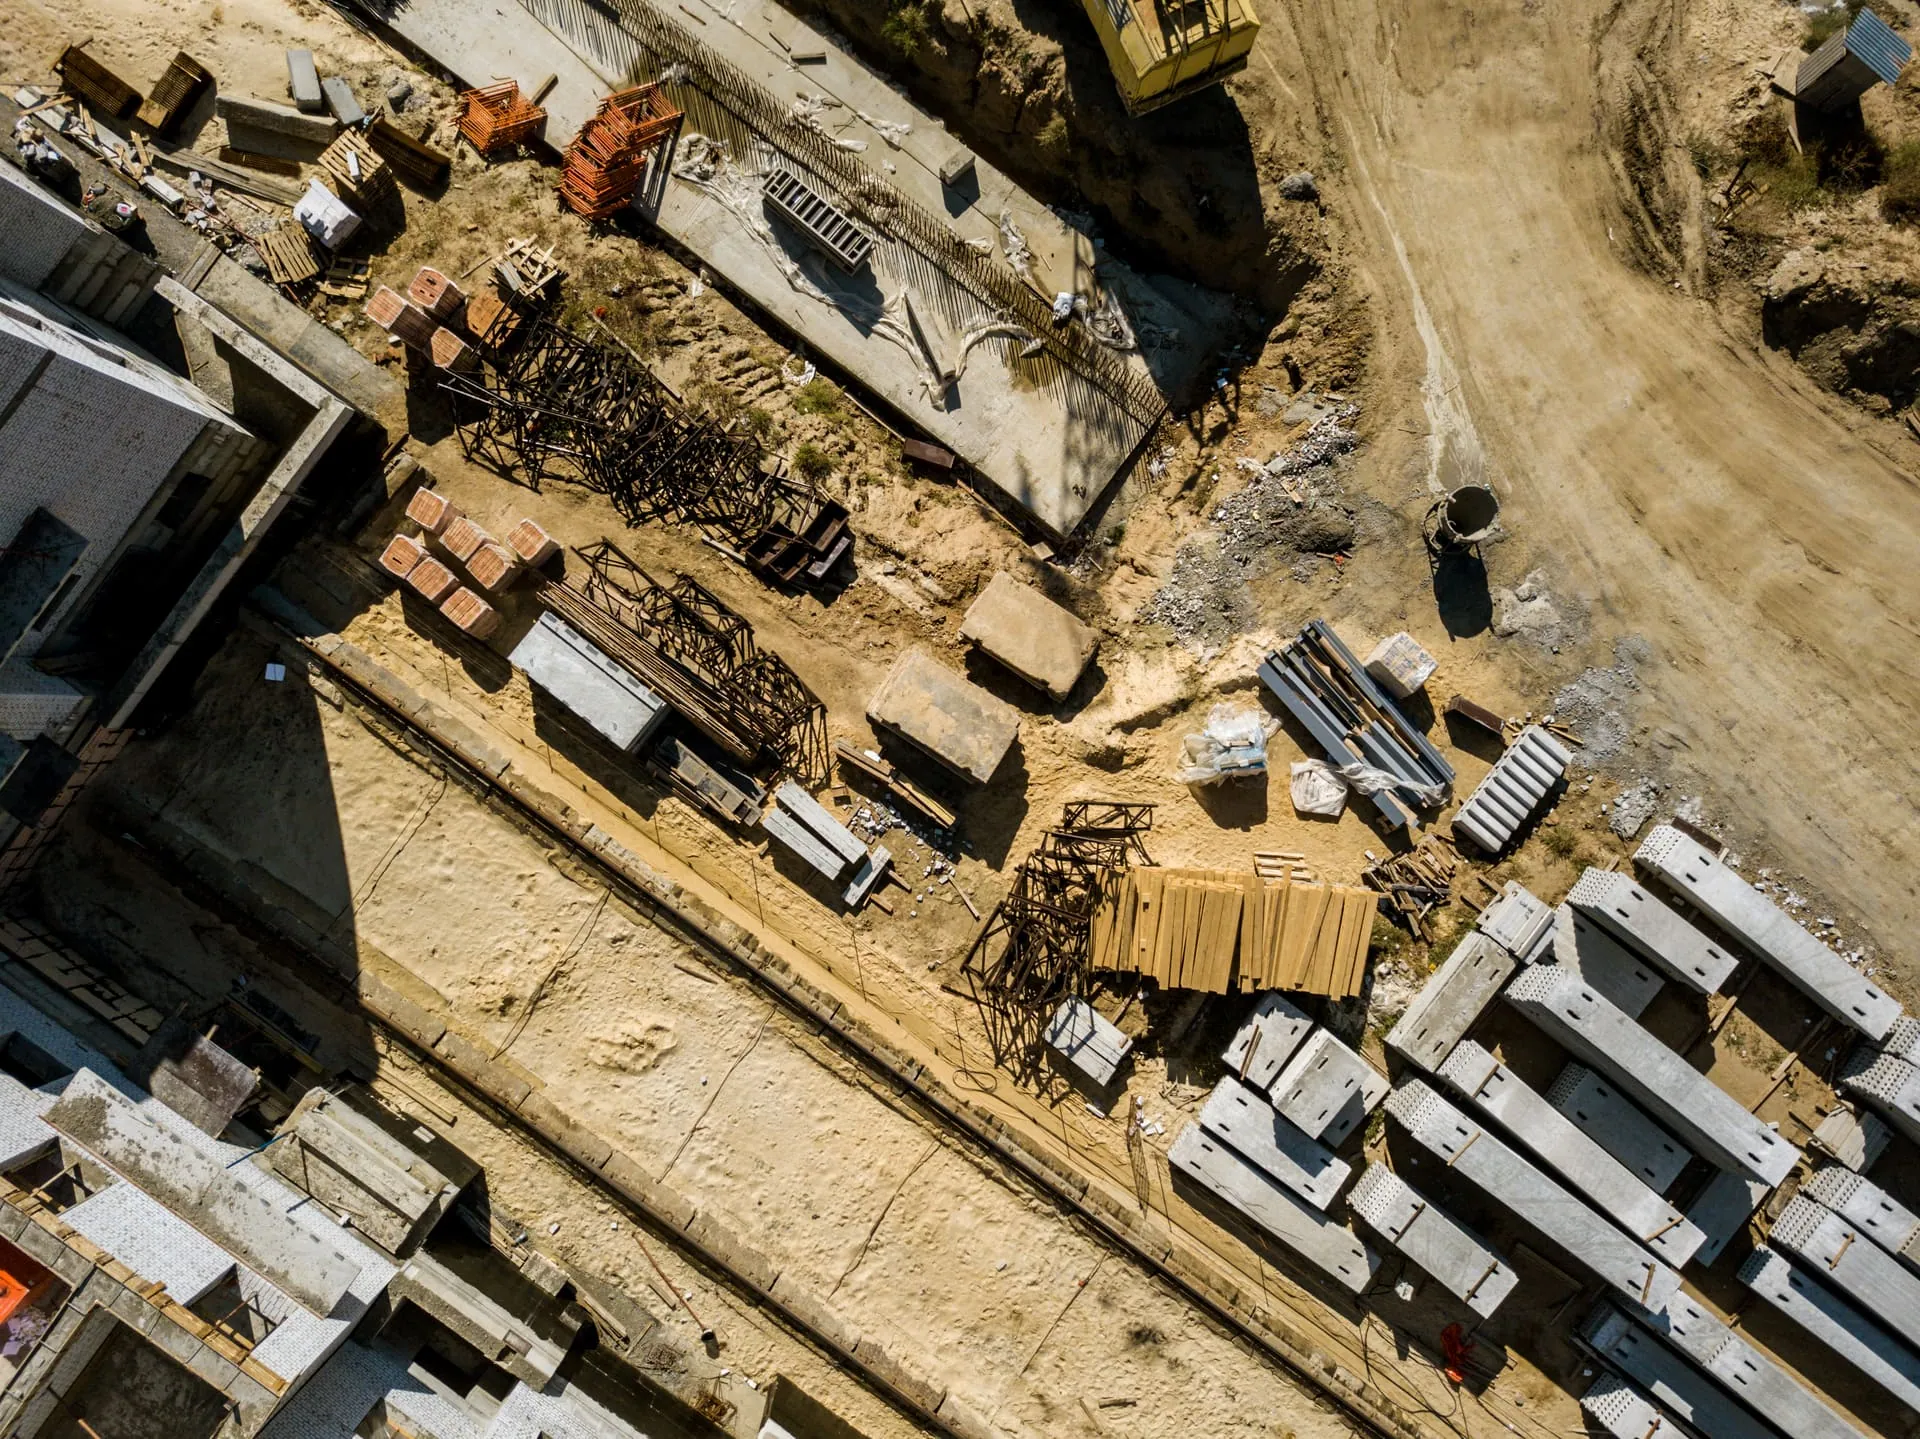
Aerial of a residential construction project in Ghana
Darikoda · Real estate developers Ghana

Protect the delivery date and the margin.

You sell off-plan. Your buyers trust your delivery date. Your margin lives between the programme and the pour.

Darikoda gives you live per-project visibility on cost, materials, and progress, so the gap surfaces while you can still act on it. Captured at source.

Typical reply within the hour during UK and Ghana business hours

You sell off-plan. Your buyers trust your delivery date. Your margin lives between the programme and the pour. Darikoda gives you live per-project visibility on cost, materials, and progress, so the gap surfaces while you can still act on it.

Where the buyer date stops matching site reality

Six places the operational truth arrives after the consequence has already landed.

  • Different performance on different projects, hidden by the aggregate.

    Five active projects, usually two healthy, two middling, one bleeding. The portfolio average makes it look balanced. The bleeder hides until quarterly review. By then the margin is already gone.

  • Performance tied to individuals, not the team.

    A site might be hitting numbers because two of five operators carry the rest. The team average hides this until one of them leaves. Attribution per operator, supervisor, machine, shift and project is the fairer basis for coaching, recognition and continuity.

  • Customer refunds triggered by missed delivery.

    The off-plan buyer signed a contract with a delivery date. The date slips. Your defence is operational evidence: was the slip foreseeable, was it managed. Without that record, the refund clause runs the conversation.

  • Materials variance that surfaces only at month-end.

    100 tonnes delivered. 70 became structure. 30 vanished. The variance lands three weeks after the next delivery has already been ordered. Section-level material consumption capture closes that window.

  • Cost per cubic metre for sales and margin decisions.

    Without it, sales pricing is guesswork and margin protection is reactive. Live, project-specific cost-per-output is the unit that drives the price the sales team can charge.

  • Many stakeholders, no single source.

    Architects, engineers, contractors, subs, suppliers, finance, sales, regulators. Each gets a different version filtered through different people. Role-routed dashboards from one record give each stakeholder their slice without the filter drift.

What changes when programme meets evidence

Three scenarios where the truth arrives before the consequence.

Old way

Off-plan buyer calls. Delivery slipped by six weeks. Your operations team did not see it coming. The refund clause is now the conversation. Your defence is the operational record, and the record does not exist outside three WhatsApp threads.

On Darikoda

Programme vs evidence drift surfaces in week three of the slip, not at week six. The intervention window opens before the buyer's call lands. If the date still slips, the operational record documents what was foreseeable and what was managed.

Three weeks earlier

buyer-conversation visibility on average across pilot developers.

Old way

BoQ said 1,200 tonnes. 1,500 tonnes delivered. 350 tonnes vanished between stockyard and structure. The variance lands at month-end reconciliation. The supplier dispute begins. The block is already on the next phase.

On Darikoda

Material consumption at the section. Variance against BoQ flags the day it crosses the threshold. The intervention happens before the next delivery is ordered, not three weeks after the fact.

20-30 days earlier

detection latency reduction on aggregate-and-cement variance.

Old way

Five projects, portfolio shows healthy 8% margin. Block B has been running at -3% for ten weeks. The aggregate has been hiding it. By the time it surfaces at quarterly review, the recovery window is closed.

On Darikoda

Per-project profitability side by side. Block B diverges in week three, not at quarterly review. Sales pricing, contractor management, material allocation become evidence-led, not pattern-recognised.

10 weeks earlier

the bleeding project surfaces. The recovery window opens with it.

Different scenarios. Same underlying gap. Same closing move.

Three engines applied to a developer

The operating record, framed for the FD's dashboard and the buyer's delivery date.

ENGINE 01

Per-project profitability, surfaced live.

Cost per cubic metre, per home unit, per phase. Live and side by side across the portfolio. The bleeder shows up in week three, not at quarterly review. The intervention window opens ten weeks earlier.

ENGINE 02

Early-warning on missed delivery.

When operating evidence no longer supports the delivery date you sold off-plan, Darikoda surfaces the warning before the buyer rings. Time to intervene before the relationship breaks.

ENGINE 03

Materials truth at section level.

Aggregate delivered vs aggregate consumed against BoQ, surfaced the day variance appears. Shortfall surfaces before the crew arrives at an empty stockpile. Stolen-material gaps surface before the next order is placed.

Proof point

A live dashboard the developer's FD or COO can open at any moment and see: budget vs actual on every active section, material consumption variance, subcontractor performance, projected delivery dates with operational evidence beneath each one, and per-cubic-metre cost across every project side by side.

Built so the per-project record survives the buyer phone call.

Developer portfolios live or die on the integrity of the per-project record. Six operational commitments make that record survive the trip from section to delivery-date defence.

  • Every field write across every active project saves locally first and syncs when signal returns. Block A and Block D do not need separate workflows.
  • Every transaction has a sync state. No silent gaps between site reality and the FD dashboard.
  • Every action is attributed to a PIN-level worker, role, project, and time. The audit trail is the record that survives a refund-clause dispute.
  • Role-routed dashboards. FD sees portfolio finance. COO sees operational exception roll-ups. Site engineer sees the section. Sales director sees delivery confidence. One record, multiple cuts.
  • Failed syncs become visible issues, not silent gaps in the per-project record.
  • Existing accounting or ERP gets fed the per-project, per-section truth it cannot produce on its own.

If you do nothing

The cost of one more quarter on the portfolio aggregate.

Illustrative scenarios at typical mid-market Ghana developer scale. The audit produces the specific number for your portfolio, your unit mix, and your delivery-date exposure.

Scenario 01

One bleeding project hidden by the portfolio aggregate for a quarter.

GHC 60M project running 11% over budget on materials and labour. Hidden by the portfolio average for 10 weeks = roughly GHC 1.2M absorbed before quarterly review.

Per-project profitability surfaces the divergence in week three. The recovery window opens with it.

Scenario 02

30% materials variance on a single block.

1,500 tonnes delivered, 1,050 became structure. At GHC 400/tonne, that is GHC 180K absorbed per block per quarter on unevidenced supplier disputes.

Section-level capture closes the window before the next delivery is ordered.

Scenario 03

Six-week buyer-conversation surprise on one project.

A 50-unit off-plan project. Refund clauses on six units triggered. At GHC 480K per unit deposit + GHC 50K dispute-handling cost per case = roughly GHC 3.3M absorbed in one buyer-conversation event.

Early-warning visibility three weeks before the call lands compresses the response window to manageable.

Scenario 04

Stolen materials at one stockyard.

30 tonnes aggregate × GHC 400/tonne × monthly = GHC 12K leaking per stockyard per month into 'shrinkage'.

GHC 144K per year per stockyard. The structured ledger turns shrinkage into a recovery conversation.

Most developers recognise three of four of these in their last quarterly review.

Inside a typical month

What a Darikoda month looks like across a developer portfolio.

From per-project field capture in week one, to evidence-led sales pricing decisions by month two.

  1. Week 1

    Per-project field capture goes live.

    Each section feeds the per-project record. PIN attribution, GPS, time-stamps. Materials, labour, plant, output. The portfolio average stops absorbing the truth.

  2. Week 2

    Per-project margin dashboards surface on the FD's phone.

    Block A healthy. Block B drifting. Block C bleeding. The aggregate is no longer the only number. The bleeder is named.

  3. Week 3

    Materials variance triggers a same-day conversation.

    Aggregate, cement, blockwork. Variance against BoQ flags the day it crosses the threshold. The supplier dispute happens before the next delivery, not three weeks after.

  4. Week 4

    Programme vs operational evidence surfaces delivery-date risk.

    When the operational record no longer supports the off-plan promise, the early warning lands on the FD and the sales director before the buyer rings.

  5. Month 2 onwards

    Sales pricing and contractor management become evidence-led.

    Per-cubic-metre cost informs pricing on the next phase. Contractor performance per project informs the next renewal. The portfolio operates on operational truth rather than pattern recognition.

A note from Theo

The buyer rings before the operations team has the answer.

Most Ghana real-estate developers I have spoken to share a quiet anxiety. The buyer rings before the operations team has the answer. The quarterly review surfaces the bleeding project a quarter too late. The materials shortfall on Block C is a dispute, not a recovery conversation, because the evidence is three WhatsApp threads. The operating record is the layer that closes that time gap. Per-project profitability surfaces live. Materials variance flags same-day. Programme-vs-evidence drift triggers the early warning before the buyer calls. The portfolio operates with the truth before the consequence arrives, not after. That is what we built for developers selling off-plan in Ghana.

Theo Ilori, founder of Darikoda

Theo Ilori

Founder, Darikoda. UCL MSc Mechanical Engineering. Formerly GE precision turbines, Caterpillar/Unatrac Ghana & Nigeria.

Real estate developer FAQ.

The questions other Ghana developers ask in the first call.

We have five active projects of different sizes. How does Darikoda show that?

Per-project profitability is the headline view. Each project shows live cost vs budget, materials variance vs BoQ, progress vs programme, and projected delivery date with the operational evidence beneath it. Side by side, so the diverging project is named, not buried in the average.

We sell off-plan. How does the platform help with delivery-date defence?

Two ways. First, early-warning on the delivery date itself, surfaced when operational evidence no longer supports the promise. Second, the audit trail that documents what was foreseeable and what was managed, which is the record that survives a refund-clause dispute.

We carry a portfolio of contractors. Does Darikoda hold them accountable?

Yes. Independent measurement of contractor output, materials supplied vs used, cert defendability and approval velocity all sit in one record. The same evidence that defends your delivery date to buyers defends your deductions to contractors.

Our buyers verify GREDA membership, AMA permits, EPA compliance. Does the operating record matter for that?

Published buyer guidance in Ghana increasingly emphasises legal certainty, financial resilience, execution track record, quality assurance and post-acquisition support. The developer's operational record is now part of how the buyer evaluates the developer. A clean structured record is a credentialing asset, not just an internal one.

Who actually sees the data?

Role-routed by design. The FD sees portfolio finance. The COO sees operational exception roll-ups. The site engineer sees the section. The sales director sees delivery confidence. One record, multiple cuts. No one gets a noisy dashboard for someone else's job.

Want the leakage map for your project portfolio?

30 minutes on WhatsApp. You keep the map regardless of next steps.

← Back to construction operations overview

Patterns described here are drawn from extensive field audits and industry research across Ghana's mining, construction, roadworks, and quarry sectors. No specific operator is named or identifiable.

Message Theo to book the audit