Darikoda · Mine operators Ghana
A cost-per-tonne you can trust.
Trace a shift total back to the event behind it.
Open the record behind the shift.
- 01
Fuel
Issue and receipt
Compare the same event
- 02
Plant
Running and stopped
Inspect the machine record
- 03
Production
Output by shift
Check the recorded basis
What this example showsUnderstand the scope and limits of this illustrative example.Check the example context Close section
Follow one control gap down to the event before drawing a conclusion about the whole operation.
You own the mine. You carry the cost-per-tonne, the royalty exposure, and the Minerals Commission relationship.
Darikoda turns your fleet, fuel, and production into a live cost-per-tonne and a compliance-ready operating record. Captured at source.
At a glance
You own the mine. You carry the cost-per-tonne, the royalty exposure, and the Minerals Commission relationship. Darikoda turns your fleet, fuel, and production into a live cost-per-tonne and a compliance-ready operating record.
Mining / Full miner
One record. Three acts. Scroll it.
The same operating record, morphing as you scroll: the gap you carry made visible, the control that closes it, then the record on the other side.
Scroll through the example ↓ · Step 1 of 3
Cost per tonne, fleet, live vs target 9.00
GHS 15 vs 8/t
81%
68%
GHS 88,000
9 vs 15 months
Curve steepening
Two trucks on the same haul road are running GHS 15/t against GHS 8/t and the divergence has been live for six weeks unseen.
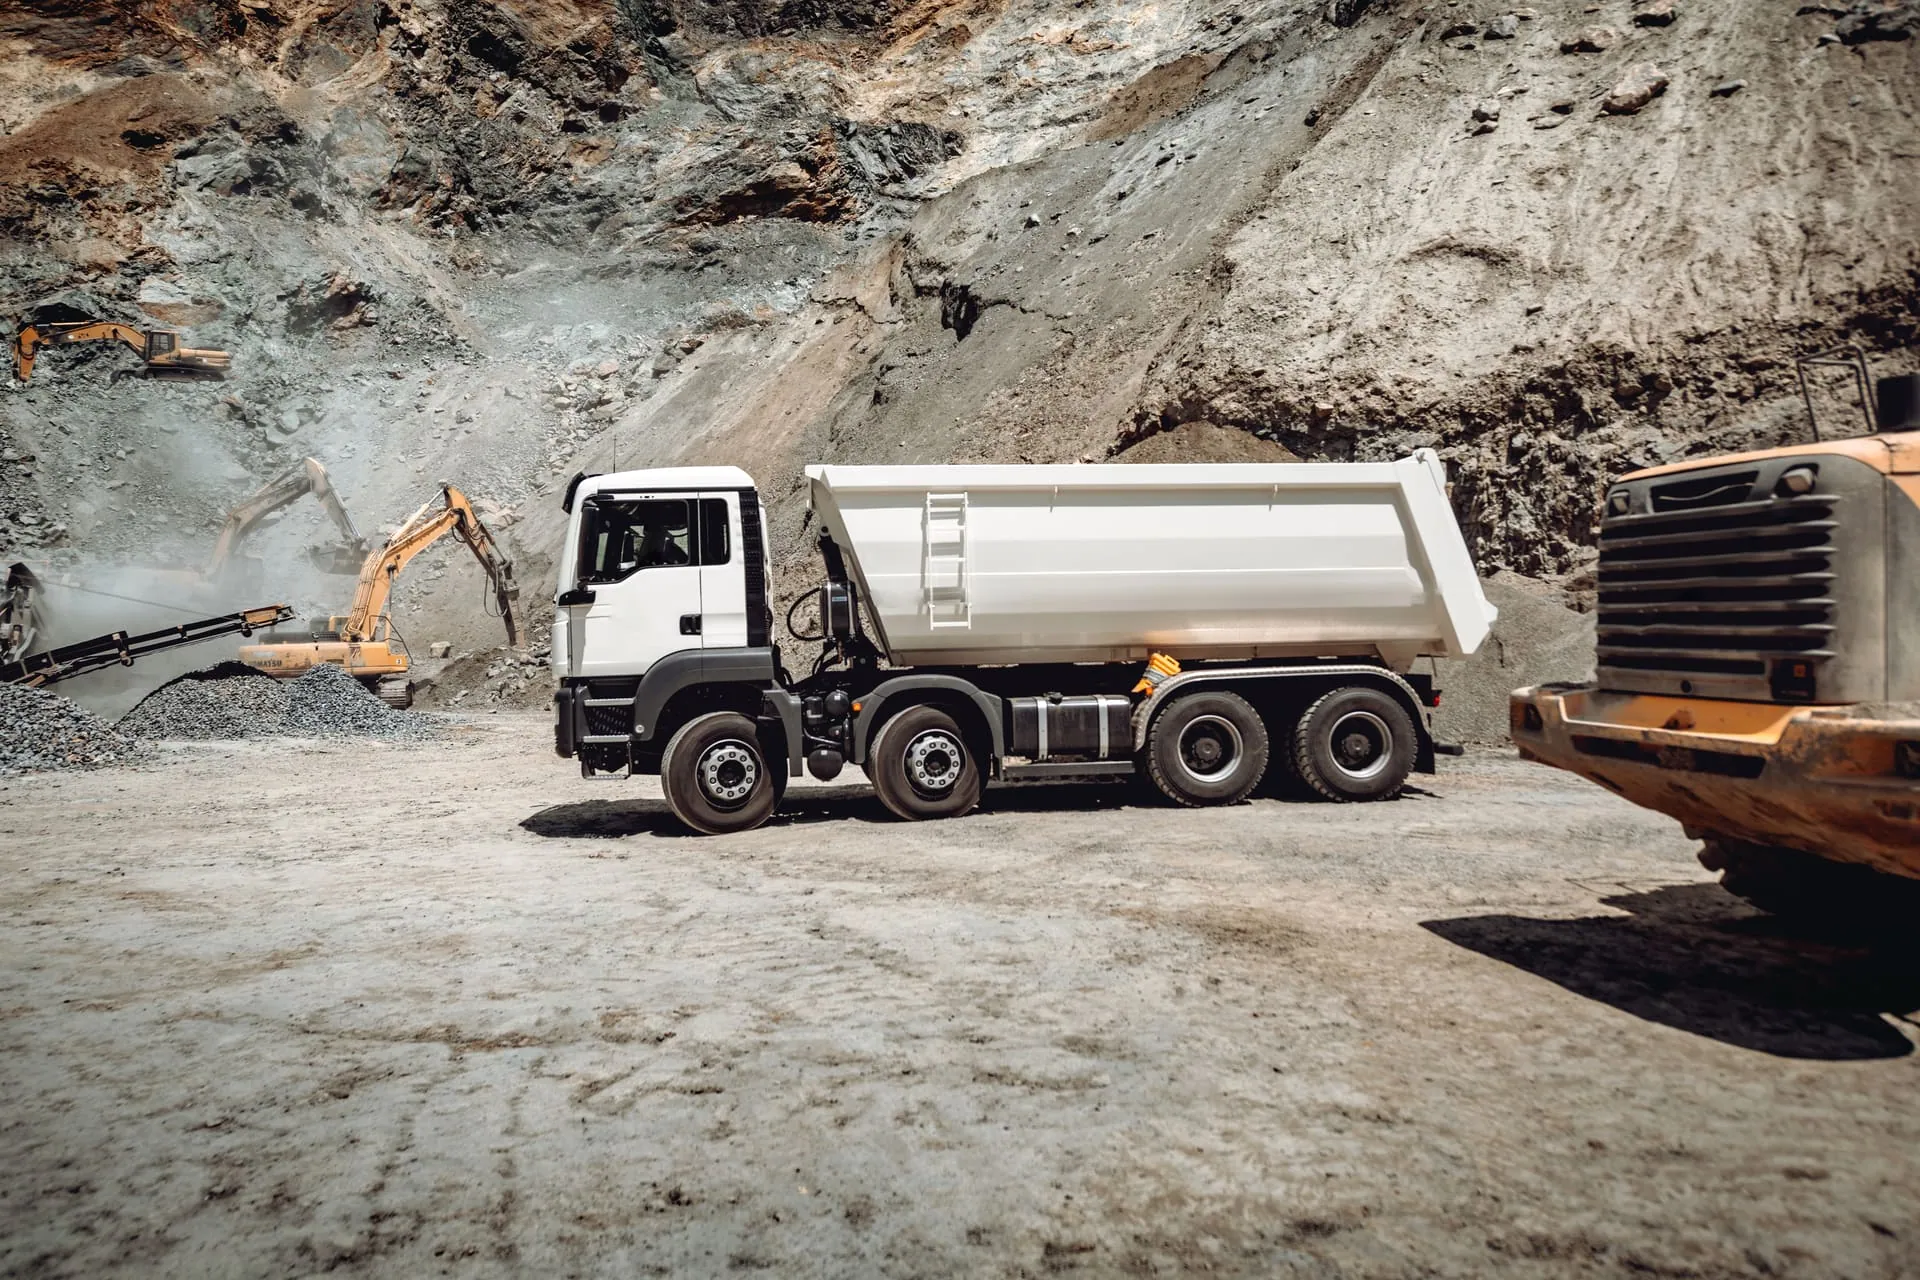
Cost-per-tonne is decided here, not at quarter-end.
Per haul road, per truck, per shift. The cost-per-tonne that protects your margin under the royalty curve is set in the pit, not found at quarterly review.
The numbers the mine runs to
The numbers that separate a mine making money from a mine paying for idle assets.
Cost-per-tonne and cost-per-ounce as live numbersSee why this matters Close section
The golden metrics, the inputs behind your all-in sustaining cost. Per haul road, per truck, per shift, per operator. Live, not lagged. Under the new sliding-scale royalty regime, the curve is steeper at high gold prices, which means every cedi of avoidable operating leakage hurts more.
Mechanical above 85%, physical above 90%, utilisation above 75%See why this matters Close section
The targets that separate a mine making money from a mine paying for idle assets. Per machine, not per fleet. The asset pulling the average down is named, not averaged into anonymity.
Stripping ratio visibilitySee why this matters Close section
The relationship between waste moved and ore exposed, the bank cubic metres behind every gram, tracked over time with cost attribution. Without it, the pit plan and the cost plan drift apart silently.
Fuel integrity across the bowser-to-engine chainSee why this matters Close section
You store it. You dispense it. You account for it. One of the largest cost lines in the operation. A variance surfaces as an issue the day it appears, tied to the operator and machine behind it.
OTR tyre life as real moneySee why this matters Close section
Six per truck. USD 30 to 60K each. USD 180 to 360K per set. Attribution per operator, haul road, loading style turns tyre life from a fixed cost into a controllable cost.
Minerals Commission compliance under L.I. 2431See why this matters Close section
The sixth-edition procurement-list framework is part of how the operating record is built. Ghana-specific compliance is the first context, not a bolt-on. With surface mining moving to Ghanaian-owned operators, local-content and local-spend reporting has to be evidenced at the source, not reconstructed at the review.
What changes when the record is structured
Three scenarios where the operating record changes the unit economics.
Worked scenarios show how evidence changes a decision. They are illustrations, not published customer outcomes. (Illustrative model, your number from the audit.)
01 / Cost-per-tonne by truck, by haul road, by shiftCompare the old way with a recorded workflow and inspect the assumptions.Compare the worked examples Close section
Two haul trucks run the same route with the same load. Month-end reconciliation lands. One reads GHS 15/tonne. The other reads GHS 8/tonne. The pattern has been live for six weeks. The GM did not see it.
Live cost-per-tonne per truck, per haul road, per shift, per operator. The diverging truck shows up the day it diverges. The fault, the operator, the loading style, the haul-road grade. All attributed in the same record.
Per-truck cost
live, not lagged. The number you can take to a workshop conversation.
02 / Fuel integrity across the bowser-to-engine chainCompare the old way with a recorded workflow and inspect the assumptions.Compare the worked examples Close section
Diesel dispensed at the mine bowser. Recorded on paper at the dispense. Recorded again at month-end on the workshop spreadsheet. Variance over 5% is normal and absorbed. The dispense clerk turns over twice a year and the records reset.
Every dispense tied to the operator, machine and project behind it at the bowser, reconciled against shift consumption. A variance opens an issue the day it appears, not a memory three weeks later.
5% recovery
USD 5K back to margin per month on a USD 100K monthly diesel spend. (Illustrative model, your number from the audit.)
03 / OTR tyre attributionCompare the old way with a recorded workflow and inspect the assumptions.Compare the worked examples Close section
Six tyres per truck, USD 30-60K each. Two trucks burn through sets every nine months. Two trucks last fifteen. The pattern is operator and haul-road dependent but no one has the per-asset, per-operator history to prove it.
Tyre life per truck, per operator, per haul road, per loading style. The pattern surfaces in the second month. Coaching, route changes, and operator rotation become evidence-led, not speculative.
USD 180-360K
per truck per tyre set. Attribution is where the saving lives.
Different scenarios. Same underlying gap. Same closing move.
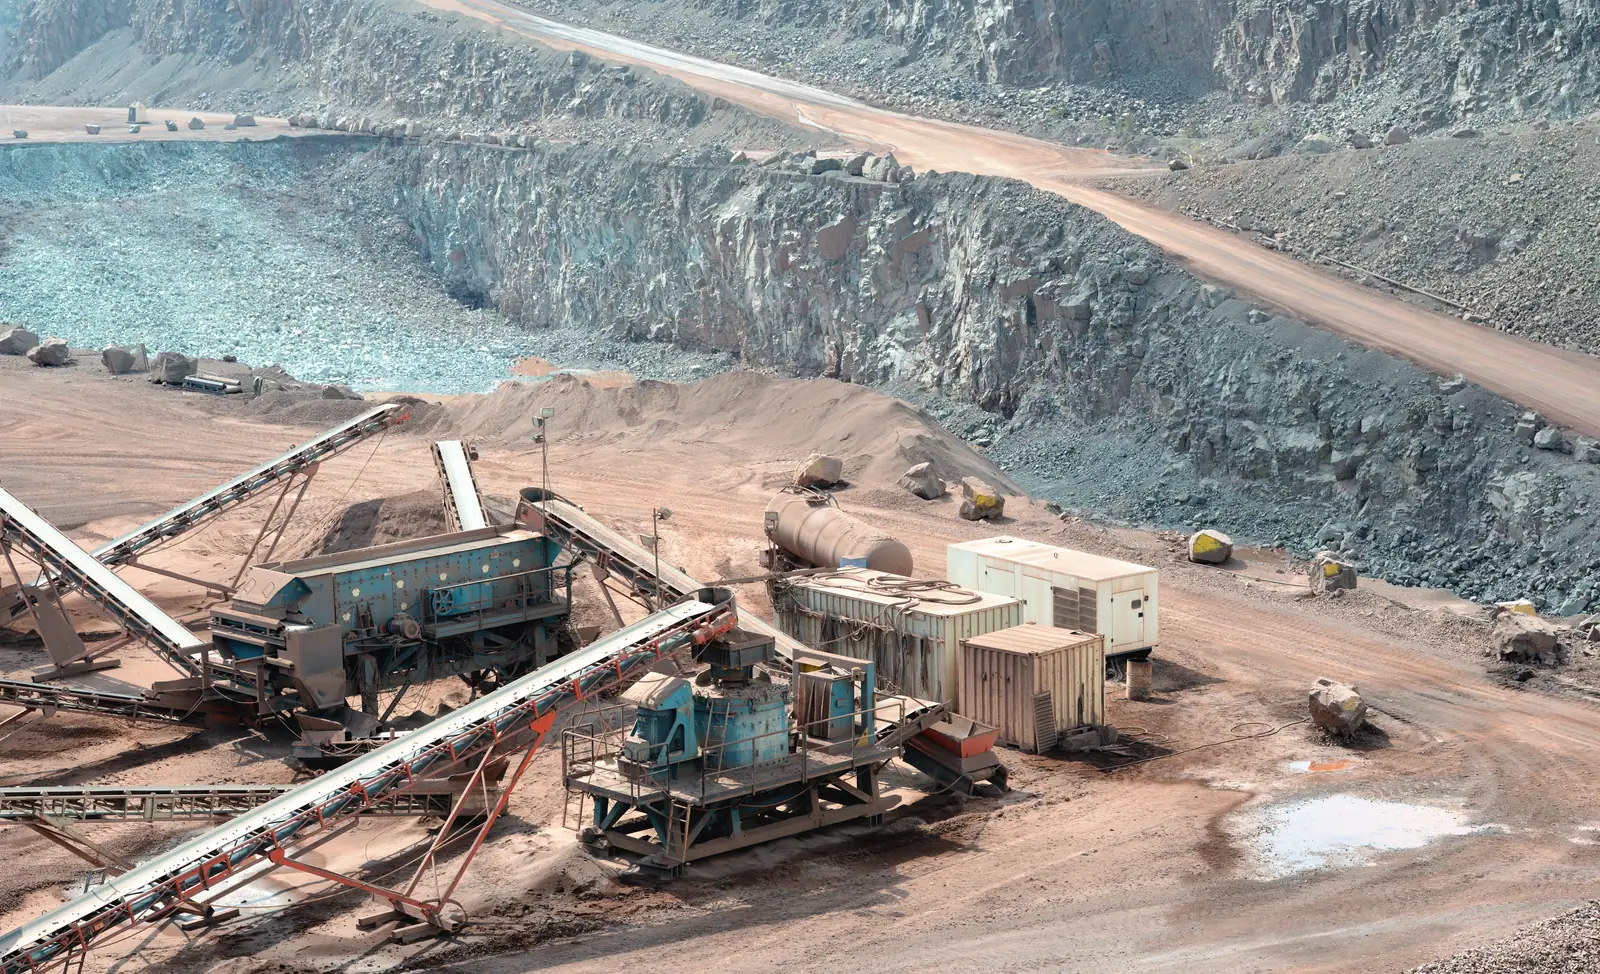
Availability is a number you show, not argue.
Per-asset uptime built from field events, the number the production plan stands on.
Built so the cost-per-tonne survives commodity-price drift.
Your cost-per-tonne is assembled from pit, bowser and workshop numbers. These commitments keep each one defendable on the way to the royalty return.
- Every field write is saved on the spot and syncs when signal returns. Pit edges and stripping benches do not wait for 4G.
- You can always see whether a field entry has reached the office yet. No silent gaps in the daily production record.
- Every fuel event, hour-meter, and fault is attributed to operator PIN, machine, project, and time. Royalty reporting traces back to a structured source.
- Shared tablets at the bowser use PIN-level operator attribution. The dispense clerk, the operator, and the supervisor each leave a clean trail.
- Failed syncs at the pit edge become visible issues, not silent gaps in the Minerals Commission record.
- Finance, operations, and the Minerals Commission see the same source record. The royalty return is built from the operating ledger, not reconstructed alongside it.
Inside a typical month
What a Darikoda month looks like at a full mine.
From daily production capture in week one, to the royalty exposure becoming a managed line by quarter two.
01 / Week 1
Daily production capture goes live
Hauls per truck per shift, tonnes loaded, fuel dispensed at the bowser, hour-meter readings, fault reports. All PIN-attributed, all time-stamped, all syncing from the pit edge.
02 / Week 2
First cost-per-tonne dashboard surfaces
Per truck, per haul road, per operator. The variance between best and worst is named. Not by feel, not by quarterly reconciliation. By live evidence.
03 / Week 3
Workshop conversations shift
Mechanical availability per machine. The asset pulling the average down is named. The intervention happens against a specific truck and a specific failure mode, not against a fleet aggregate.
04 / Week 4
Monthly Minerals Commission pack built from the record
Production, fuel, royalty calculation, plant register. Structured per asset, per shift, per operator. The return is an export, not a reconstruction.
05 / Quarter 2
Royalty exposure becomes a managed line
Cost-per-tonne and cost-per-ounce trend lines surface against the royalty curve. Pricing decisions, hedging conversations, and capital-allocation calls become evidence-led instead of estimate-led.
Example operating cadence after activation. Rollout timing and acceptance criteria are agreed for your operation.
Field note from Darikoda
“The pit produced more than the workshop record reflected.”
Read the field context and attributionSee where this observation comes from and the context behind it.Read the field context Close section
The Ghana mines our founder worked alongside at Caterpillar and Unatrac shared the same operational pattern. The pit produced more than the workshop record reflected. The bowser dispensed more than the fuel ledger could explain. The royalty return was reconstructed at quarter-end from three spreadsheets and a long memory. Operationally these mines were sound. Financially they were absorbing 5-10% leakage that nobody could quite name. The operating record is the layer that names it. Per-truck, per-operator, per-shift, captured at the event. The royalty curve becomes a managed exposure rather than an absorbed shock. We built Darikoda to be that layer.
Darikoda Systems Ltd
Founder-led, engineer-built. UCL MSc Mechanical Engineering. GE precision turbines. Four years inside Caterpillar and Unatrac heavy fleet operations across Ghana and Nigeria.
Mine operator FAQ.
The questions other Ghana mine owners ask in the first call.
How does Darikoda handle the new sliding-scale royalty regime?Read the answerClose answer
Since March 2026, gold royalties rise as commodity prices rise. The cost-per-tonne and cost-per-ounce visibility Darikoda surfaces is the operational lens that turns the royalty curve from an absorbed shock into a managed exposure. Every cent of cost-per-ounce drift matters more when the curve is steeper at high prices.
What does the December 2026 localisation deadline mean for us?Read the answerClose answer
Surface mining must be carried out by Ghanaian-owned operators, and the core blasting, loading and hauling work is moving to local contractors. Whether you self-perform or contract it out, the Minerals Commission expects local-content and local-spend reporting you can evidence. Darikoda is the operating record that makes that report an export rather than a month of reconstruction.
Are you Minerals Commission compliant?Read the answerClose answer
Darikoda is a software product, built by Darikoda Systems Ltd (registered in Ghana) with Ilori Streamline Ltd (UK, Company No. 16378536) behind it. Where the Minerals and Mining Local Content Regulations require it, we work alongside Ghana-registered partner engineering firms. The L.I. 2431 sixth-edition procurement-list framework is part of how we built the product, not an afterthought.
What if our fleet is mixed-OEM?Read the answerClose answer
Mixed fleets are the norm in Ghana. Darikoda is OEM-agnostic. The operating record is captured at the operational layer (operator, project, shift, fuel event, downtime cause) so the asset record is consistent whether the machine is a CAT, Volvo, Komatsu or Hitachi. Telemetry integration where it exists is additive, not required.
If two haul trucks run the same route with the same load and one costs GHS 15/tonne and the other costs GHS 8/tonne, would you know?Read the answerClose answer
On the current month-end cycle, probably not. On Darikoda, the variance surfaces within hours of the divergence, on a per-truck per-route basis.
How does the platform handle remote pit sites on patchy 4G?Read the answerClose answer
Every field write saves locally first and syncs when signal returns. Operators do not wait for connectivity to record a fuel event, an hour-meter reading or a fault report. Failed syncs become visible issues, not silent gaps. Sites with Starlink plus patchy 3G/4G are well within the operating envelope.
From the Operating Notes
Field analysis that goes deeper on this.
Want the leakage map for your mine?
30 minutes on WhatsApp. You keep the map regardless of next steps.
Patterns described here are drawn from extensive field audits and industry research across Ghana's mining, construction, roadworks, and quarry sectors. No specific operator is named or identifiable.