
Royalty changes affect the financial model. Machine-level records help you manage the operating costs within it. Keep the two calculations distinct and trace cost-per-tonne changes back to the work.
On this page
Ghana's royalty changes and a mine's operating costs belong in the same financial review, but they answer different questions. The royalty calculation concerns the applicable fiscal terms. Cost per tonne helps the operations team understand what it spent to move or process material.
The 2026 context
Gold Fields' June 2026 results report that new royalty regulations took effect on 10 March 2026, with a gold-price-linked range of 5% to 12%. The same report describes protection under its development agreement for Tarkwa until April 2027. The applicable terms therefore need to be checked for the specific operation.
Keep the operating measure consistent
Define which costs and tonnes belong in the measure before comparing periods. Tonnes moved, ore processed and gold ounces produced describe different stages. Use the same basis when comparing a truck, route, shift or month.
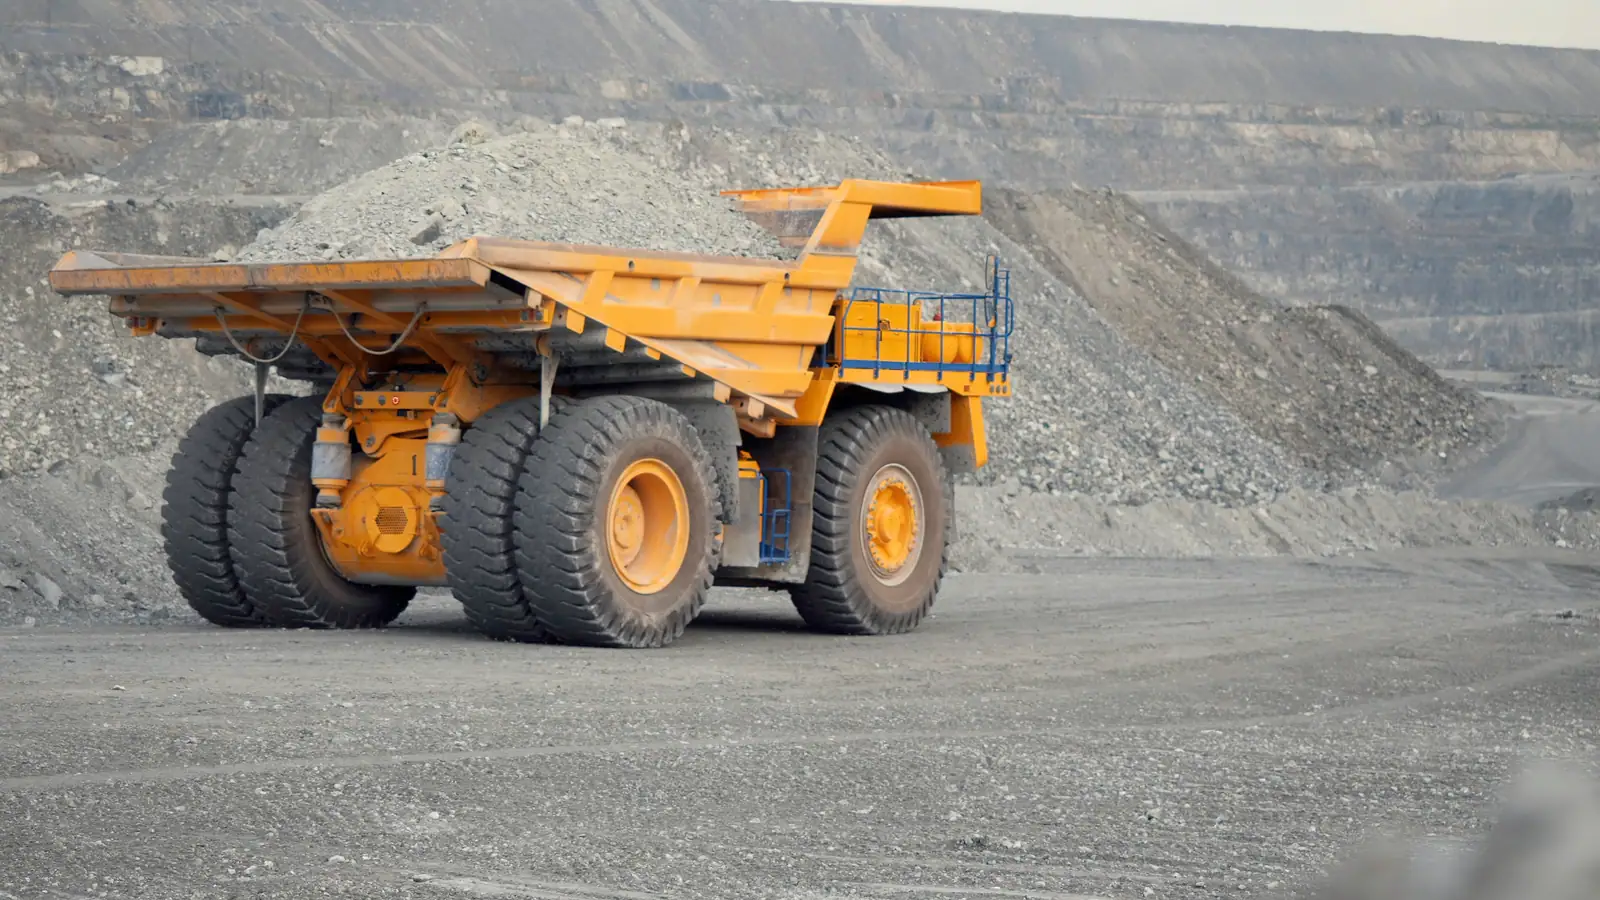
A change in fuel use, maintenance, waiting time or output can move the result. Follow the change back to its records. Check route, load, work conditions and machine availability before deciding what needs to change.
Follow a cost-per-tonne change back to its cause
Start by writing down what the numerator includes. A haulage-only measure could include the fuel, labour and maintenance assigned to hauling. A whole-operation measure has a different scope. Keep that scope stable and name the output in the denominator, such as tonnes hauled or ore processed.
A defined operating cost of GHS 120,000 divided by 10,000 tonnes is GHS 12 per tonne. If cost stays at GHS 120,000 while output falls to 8,000 tonnes, the result rises to GHS 15 per tonne. The GHS 3 change comes from lower output in this example, even though spending has not increased. (Illustrative model, your number from the audit.)
That distinction determines the next conversation. Review cycle times and waiting when output falls. Review fuel issues and repair costs when spending rises. If both move, separate their effects before choosing an action. A fleet-wide total can hide a truck or route whose records explain the change.
Read availability, utilisation and production together
A machine can be ready for work but waiting for a loading point. Another can be unavailable because a part or repair approval is outstanding. Their effect on output can look similar in a daily total, but the person who can resolve each delay is different. Keep the reason, responsible person and return-to-work plan alongside the time lost.
The haul-cycle reporting guide explains how loading, travel, queuing and dumping build up the cycle. Use that sequence to decide which comparison is fair before changing a truck allocation.
Questions for the daily review
- Which machine or route changed compared with the plan?
- Did output fall, costs rise, or both?
- Do fuel, repair and shift records explain the change?
- What action is needed, who owns it, and when will it be reviewed?
Keep the financial assumptions visible
A higher gold price, a changed royalty rate and a fuel-cost increase affect margin through different parts of the calculation. Record those assumptions separately. An operating-cost saving is useful in its own right, without assuming that every change in the royalty rate makes the same cost increase a larger share of margin.
In the management review, keep the gold-price and royalty assumptions next to the operating-cost calculation, with their source and date. A change in sale price does not explain a machine's fuel issue, and a change in tonnes hauled does not establish ounces sold. Finance and operations can then discuss the same period without treating unlike measures as interchangeable.
How Darikoda supports the operating review
Darikoda connects machine activity, fuel, downtime and supporting records so the team can investigate operating costs. Use those details alongside the financial model maintained for the mine.
Review the records behind your cost per tonne
Use the free 30-minute audit to examine the records behind one recurring fleet-cost problem. Leave with a one-page map of the practical priorities for your operation.
Read the operating view for your role