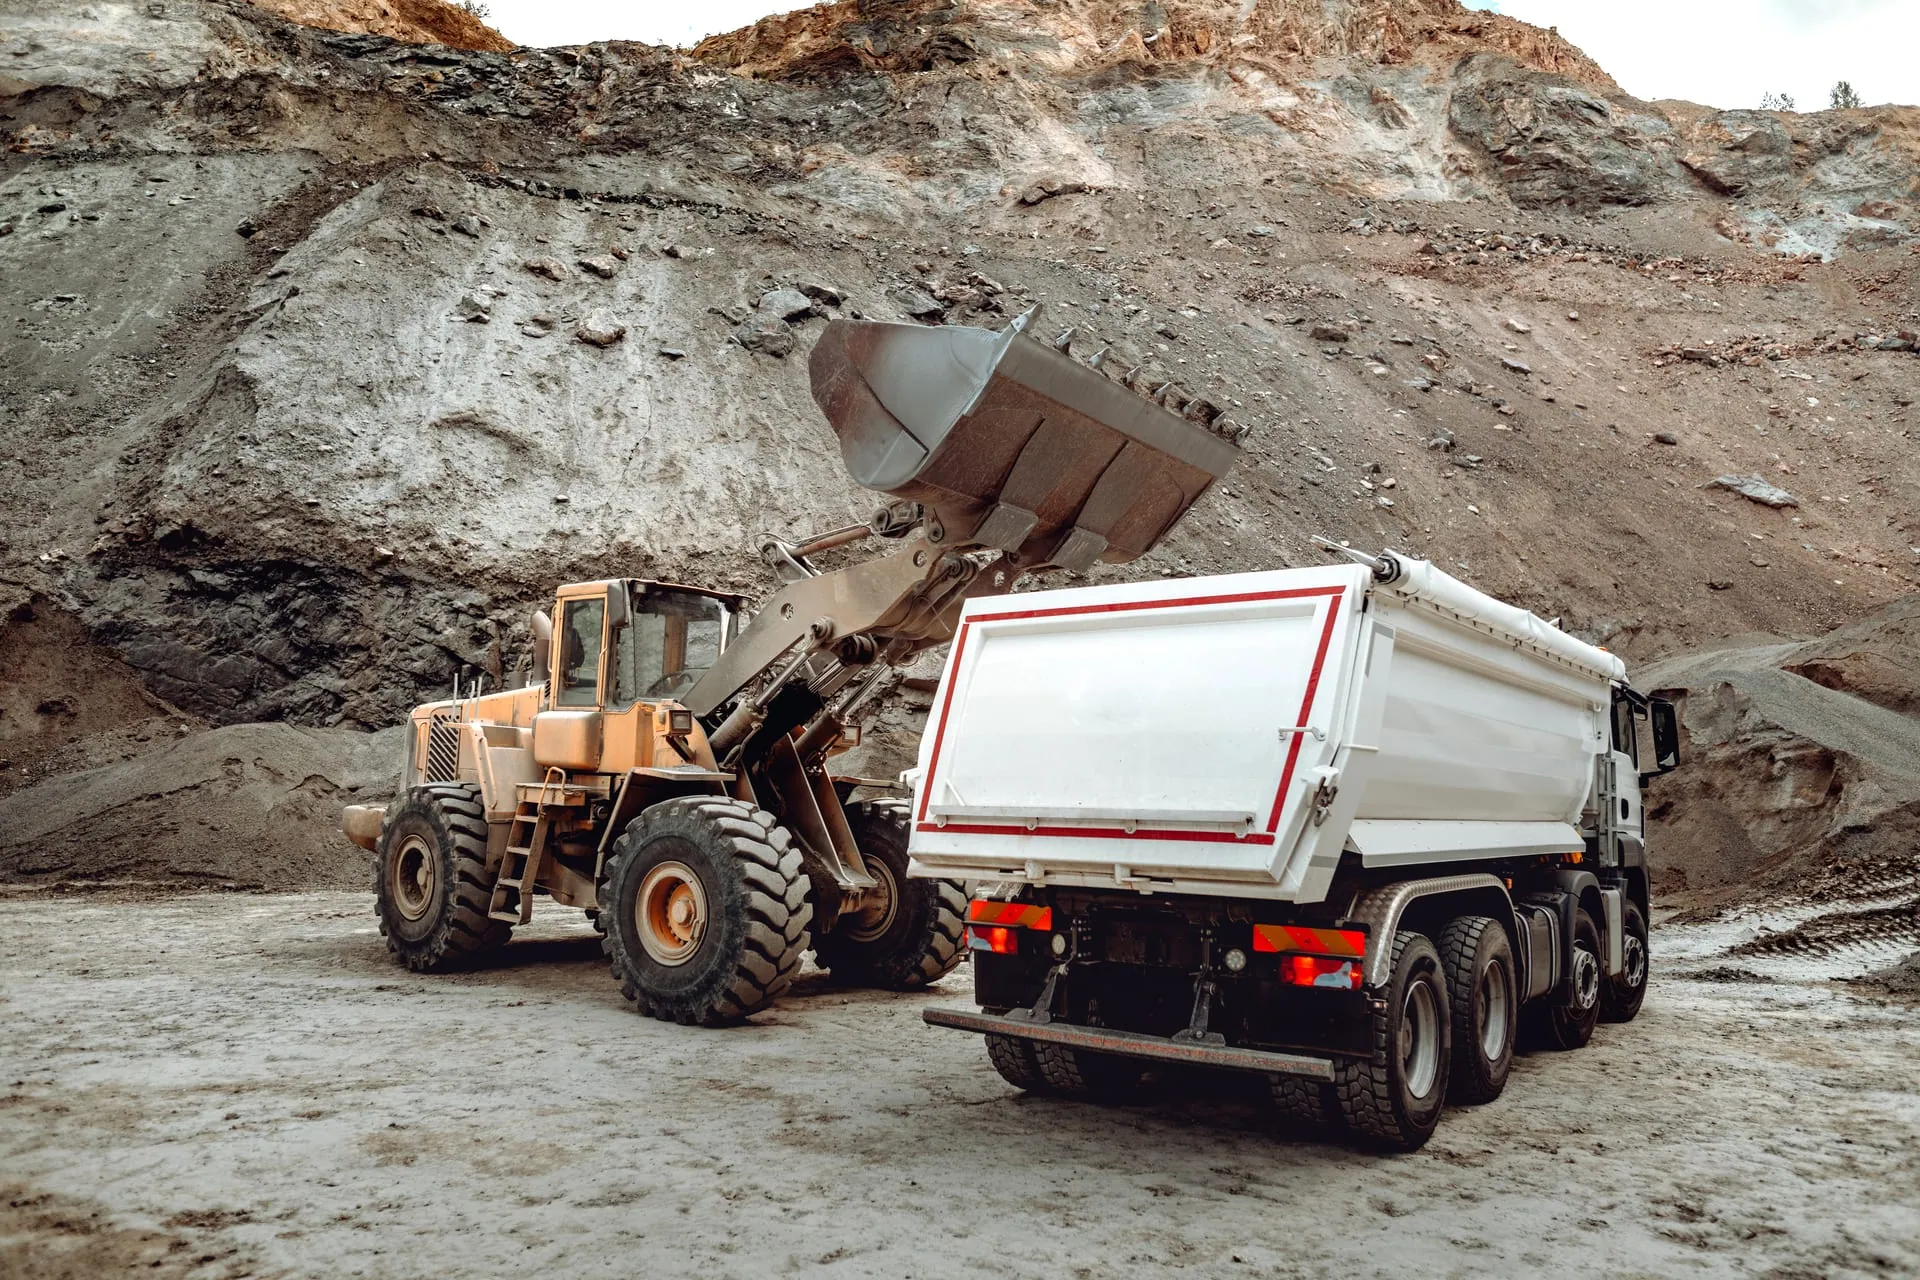
Heavy fleet operating on a working site in Ghana
Darikoda · See the operating record

You can describe the leak. Now you can see what closes it.

The record between what your machines did and what you can account for has always been the pitch. This is what it looks like on screen.

The cost of every machine, fuel evidenced at the event, margin caught before it goes, the certificate pack already assembled. Captured at source.

Reply within the hour during UK and Ghana business hours

This is the Darikoda operating record on screen: the live cost of every machine, a fuel dispense evidenced at the event, margin flagged before it erodes, downtime owned per asset, and a certificate pack assembled rather than reconstructed. What the operator gets, shown as outcomes. Captured at source.

An argument you can read is not the same as a record you can see.

For a long time the operating record was a case we made in words. The leak is real, the evidence is missing, the record closes the gap. All true, and all still just a claim until you watch it happen.

So here it is as outcomes. Not the machinery underneath, and not a feature tour. Each screen below answers one question a buyer actually asks: what do I get, and what decision does it hand me.

On screen

Six screens. Six decisions they hand you.

Read the caption under each one. That is the outcome the screen delivers, in the words you would use to a finance director.

09:41

Fleet Value-for-Money

Advisory value-for-money analytics. Ranks manufacturers by lifetime cost per hour to inform the next purchase. It never auto-procures.
All timeUpdated 2h ago

Grader

Sany

Best value

USD 71.40

lifetime cost / hr

Fuel / hrUSD 28.10
Maint / hrUSD 12.35
Assets4
Hours9,240
Cost / hr from 3 of 4 priced
Owning cheaper - 3Hiring cheaper - 1

Caterpillar

Rank 2

USD 96.80

lifetime cost / hr

Assets3
Hours7,010

Cost of every machine

The true cost of every machine, live. Renew, retire or replace stops being a hunch and becomes a decision.

09:41

Log Fuel

Saved locally

Wheel Loader 03

WL-03

Fuel quantity

260.0 L

-5
-1
+1
+5

Hour meter

4,812.5hrs
Day
Night

Dispense evidence

Photo of the meter at the machine, taken now. Logged with GPS and shift so the dispense can be trusted.

Photo capturedGPS locked

Fuel at the bowser

A fuel dispense evidenced at the event, tied to the operator and the machine it went into. The number you can stand behind at month-end.

09:41

Executive KPIs

Portfolio scope, all active projects, worst margin first.
Updated 6m ago

Rework rate

3.10%

2.5% target

Watch

Heritage Court, Phase 2

SPI 0.87
Schedule62%

62% done, planned 74%

SalesUSD 4,180,000
Cost to dateUSD 2,540,000
Forecast cost EACUSD 3,960,000
Cost to completeUSD 1,420,000
Forecast profit-USD 90,000
Spend ratio104%

USD 118,500

Delay exposure

23 days late, USD 140,000 projected

Margin before it goes

Margin drifting below what you priced, flagged while you can still steer. Not discovered at final account.

09:41

IPC Register

Each certificate is backed by field-measured quantities. Certified value is recommended for payment.

Certified value

USD 3.42M

Certificates

7

Exported

5 / 7

Awaiting export

2

IPC #7

GC-HC2-IPC-0007

Certified

USD 486,200.00

Gross this periodUSD 512,000.00
Cumulative certifiedUSD 3,420,000.00
Retention held- USD 171,000.00
Deductions- USD 25,800.00
Recommended for paymentUSD 486,200.00

Measures backing this certificate

Blockwork to Block B L2

BW-021

740 sqm, 68%

The certificate pack

A certificate pack assembled, not reconstructed. The evidence is already attached when the claim goes out.

09:41

Fleet Readiness

Readiness scope, idle owned by the machine that lost it, not averaged.

Locations

5

No loader

1

Addressable idle

22%

Deliberate idle

9%

Resource balance

North Pit

Under-loaded

Loaders

1

Haulers

6

Per loader

6.0

West Dump

No loader

Loaders

0

Haulers

4

Per loader

n/a

Idle classification

EX-14

41% idle
Addressable 33%Deliberate 8%Addressable

Idle, owned

Every idle hour owned by the machine that lost it, not averaged across the fleet. The asset dragging the month down is named.

09:41

Approvals

2 decisions taken offline, will replay on sync

Work order WO-2291

Pending
ApprovalStep 2 of 3site_manager
USD 8,400 at risk, 1,200/dayMachine idle 7h

Requested by A. Mensah. Asset: Excavator 14 (EX-14).

USD 12,750.003h ago

Auto-approved, last 7 days

Order SO-1039

USD 950.00, 2d ago

Auto-approved

Money leaves on a record

Money leaves only against a record someone approved. Who signed, on what evidence, still there next quarter.

Heavy equipment on a Ghana site at the end of a shift
One shift

The shift ends. The record does not.

From the first fuel dispense to the certificate that clears, every outcome above holds from the pit edge to the month-end review.

From capture to export, in one shift.

A short walkthrough of a working day, told as what you get, not what you tap.

  1. 01The shift starts, and the first fuel dispense is already a record, not a note to reconcile later.
  2. 02By mid-morning the cost of each machine is moving in front of you, not waiting for month-end.
  3. 03A job drifts below its priced margin and you see it while there is still a shift left to steer.
  4. 04The claim goes out with its evidence attached, and the record is still there when it is queried a quarter later.

What a Darikoda audit finds

Three fixes, ranked by what they bring back.

This is the one-page leak map the free audit produces. A sample, so you can see the shape of it before you book. Yours is built on your own operation.

Example format only. Your numbers come from the audit.Anonymised sample

Sample operation: a mid-size haulage contractor running 14 machines on day-works. Details changed. No real operator is shown.

01FuelTier A and B

What the audit sees

Diesel leaves the bowser without being tied to the machine it went into. The month-end variance gets absorbed, unrecovered.

What changes

Every dispense stands as a record you can defend. The variance turns into money you can chase.

5% recovered on a USD 100,000 monthly diesel spend is USD 5,000 a month. (Illustrative model, your number from the audit.)

02DowntimeTier B

What the audit sees

Idle hours sit inside a single breakdown line. No machine owns the loss, so the worst asset hides in the fleet average.

What changes

Idle is owned per machine. The asset dragging the month down is named, and it gets worked first.

600 idle machine-hours a year at GHS 250 an ownership-hour is GHS 150,000. (Illustrative model, your number from the audit.)

03MarginTier B

What the audit sees

Project margin only becomes visible at final account, after the drift has already been spent.

What changes

Margin drift shows while the job is still running, in time to steer instead of explain.

1 point of margin held on a USD 2,000,000 contract is USD 20,000. (Illustrative model, your number from the audit.)

The 30-minute audit produces this for your operation, ranked by likely commercial impact. You keep it regardless of next steps.

Figures above are an illustrative model on stated rates, not a measurement of any real operation. Patterns are drawn from field audits across Ghana's mining, construction, roadworks, and quarry sectors. No specific operator is named or identifiable.

Want to see this on your own operation?

Free 30-minute audit on WhatsApp. You keep the one-page leak map either way.

About what you are seeing.

Are these real screenshots?

The frames are branded placeholders while the real screens are captured from the live operation. Each carries a visible capture-pending badge until then. The outcome each screen delivers, written in the caption, is already fixed and will not change when the real image lands.

Why show outcomes instead of features?

A buyer does not buy a screen, they buy the decision it hands them. Each caption states what you get in the words you would use to a finance director: the cost of a machine, a fuel dispense you can defend, margin caught in time to steer.

Is the sample audit finding a real operator?

No. It is an illustrative model on stated rates, anonymised, with no operator named or identifiable. Every figure is tagged as illustrative. Your own numbers come from the free audit.

Can I see it running on my own fleet?

Yes. The free 30-minute audit produces a one-page leak map for your operation, with three prioritised fixes you keep regardless of next steps. Message Theo on WhatsApp to book.

See it against your own fleet.

The audit takes 30 minutes and produces a one-page leak map for your operation. You keep it regardless of next steps. Captured at source.

Shown as representative screens of the operating record, with illustrative data. Patterns described here are drawn from extensive field audits and industry research across Ghana's mining, construction, roadworks, and quarry sectors. No specific operator is named or identifiable.

Message Theo to book the audit